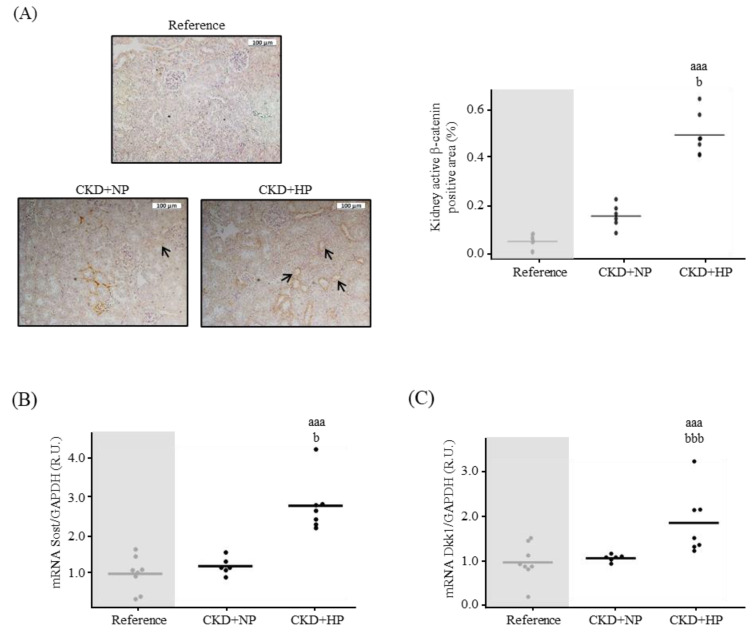
Figure 3.
In vivo effects of chronic kidney disease (CKD) and dietary phosphorus intake on components of the Wnt/β-catenin pathway in the kidney. (A) Representative images of kidney active β-catenin and its quantification from Sham (Reference) and CKD mice fed normal (NP) or high phosphorus (HP) diet for 14 weeks. Each inset indicates the relative scale in µm. Kidney (B) Sost and (C) Dkk1 mRNA levels. All values are expressed relative to reference group. Mean and individual mice values are shown. aaa p < 0.005 vs. Reference, b p < 0.05 and bbb p < 0.005 vs. CKD+NP. R.U., relative units vs. Reference. GAPDH was used as housekeeping gene.

