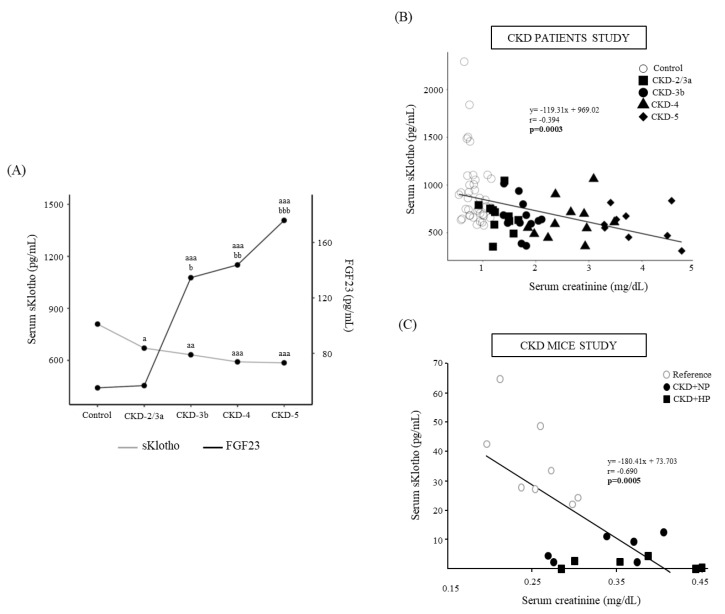
Figure 5.
(A) Serum sKlotho and FGF23 in control subjects and chronic kidney disease (CKD) patients distributed according to eGFR from KDIGO guidelines. Median are shown. a p < 0.05, aa p < 0.01, aaa p < 0.005 vs. Control, b p < 0.05, bb p < 0.01, bbb p < 0.005 vs. CKD-2/3a. Correlation between serum sKlotho and serum creatinine in (B) the individuals described in (A). Each shape represents Control (○), CKD-2/3a (■), CKD-3b (●), CKD-4 (▲) and CKD-5 (♦) values; and in (C) Sham-operated mice fed normal phosphorus (NP) (Reference) and CKD mice fed NP or high phosphorus (HP) diet for 14 weeks, each shape represents Reference (○), CRF+NP (●) and CRF+HP (■) values.

