Figure 8.
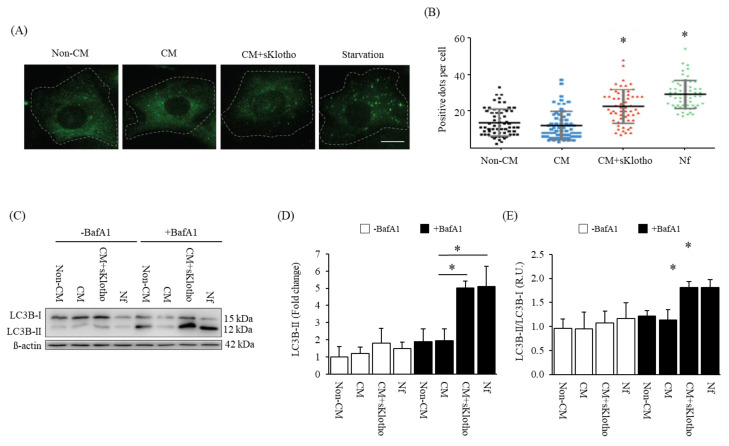
sKlotho effect on autophagy flux in primary vascular smooth muscle cells (VSMCs) (A) Representative images of LC3B-II from primary VSMCs exposed to Non-CM, CM and CM+sKlotho for 24 h. An autophagy positive control is shown (Starvation, Nutrient free medium, Nf). (B) LC3B-II puncta per cell quantification. All values are expressed relative to Non-CM condition. Mean and standard deviation values are shown. * p < 0.05 vs. Non-CM, positive LC3B-II puncta per cell. (C) Representative image of Western blot analysis and relative quantification of LC3B-II/LC3B-I ratio of primary VSMCs exposed to Non-CM, CM and CM+sKlotho for 24 h. An autophagy positive control is shown (Nf group). β-actin was used as a loading control. The Western blot image shows the experiment under –Bafilomycin and +Bafilomycin exposures. Relative quantification of LC3B-II protein (D) and LC3B-II/LC3B-I ratio (E). All values are expressed relative to Non-CM condition. Mean and standard deviation values are shown. * p < 0.05 vs. Non-CM, R.U: Relative Units.

