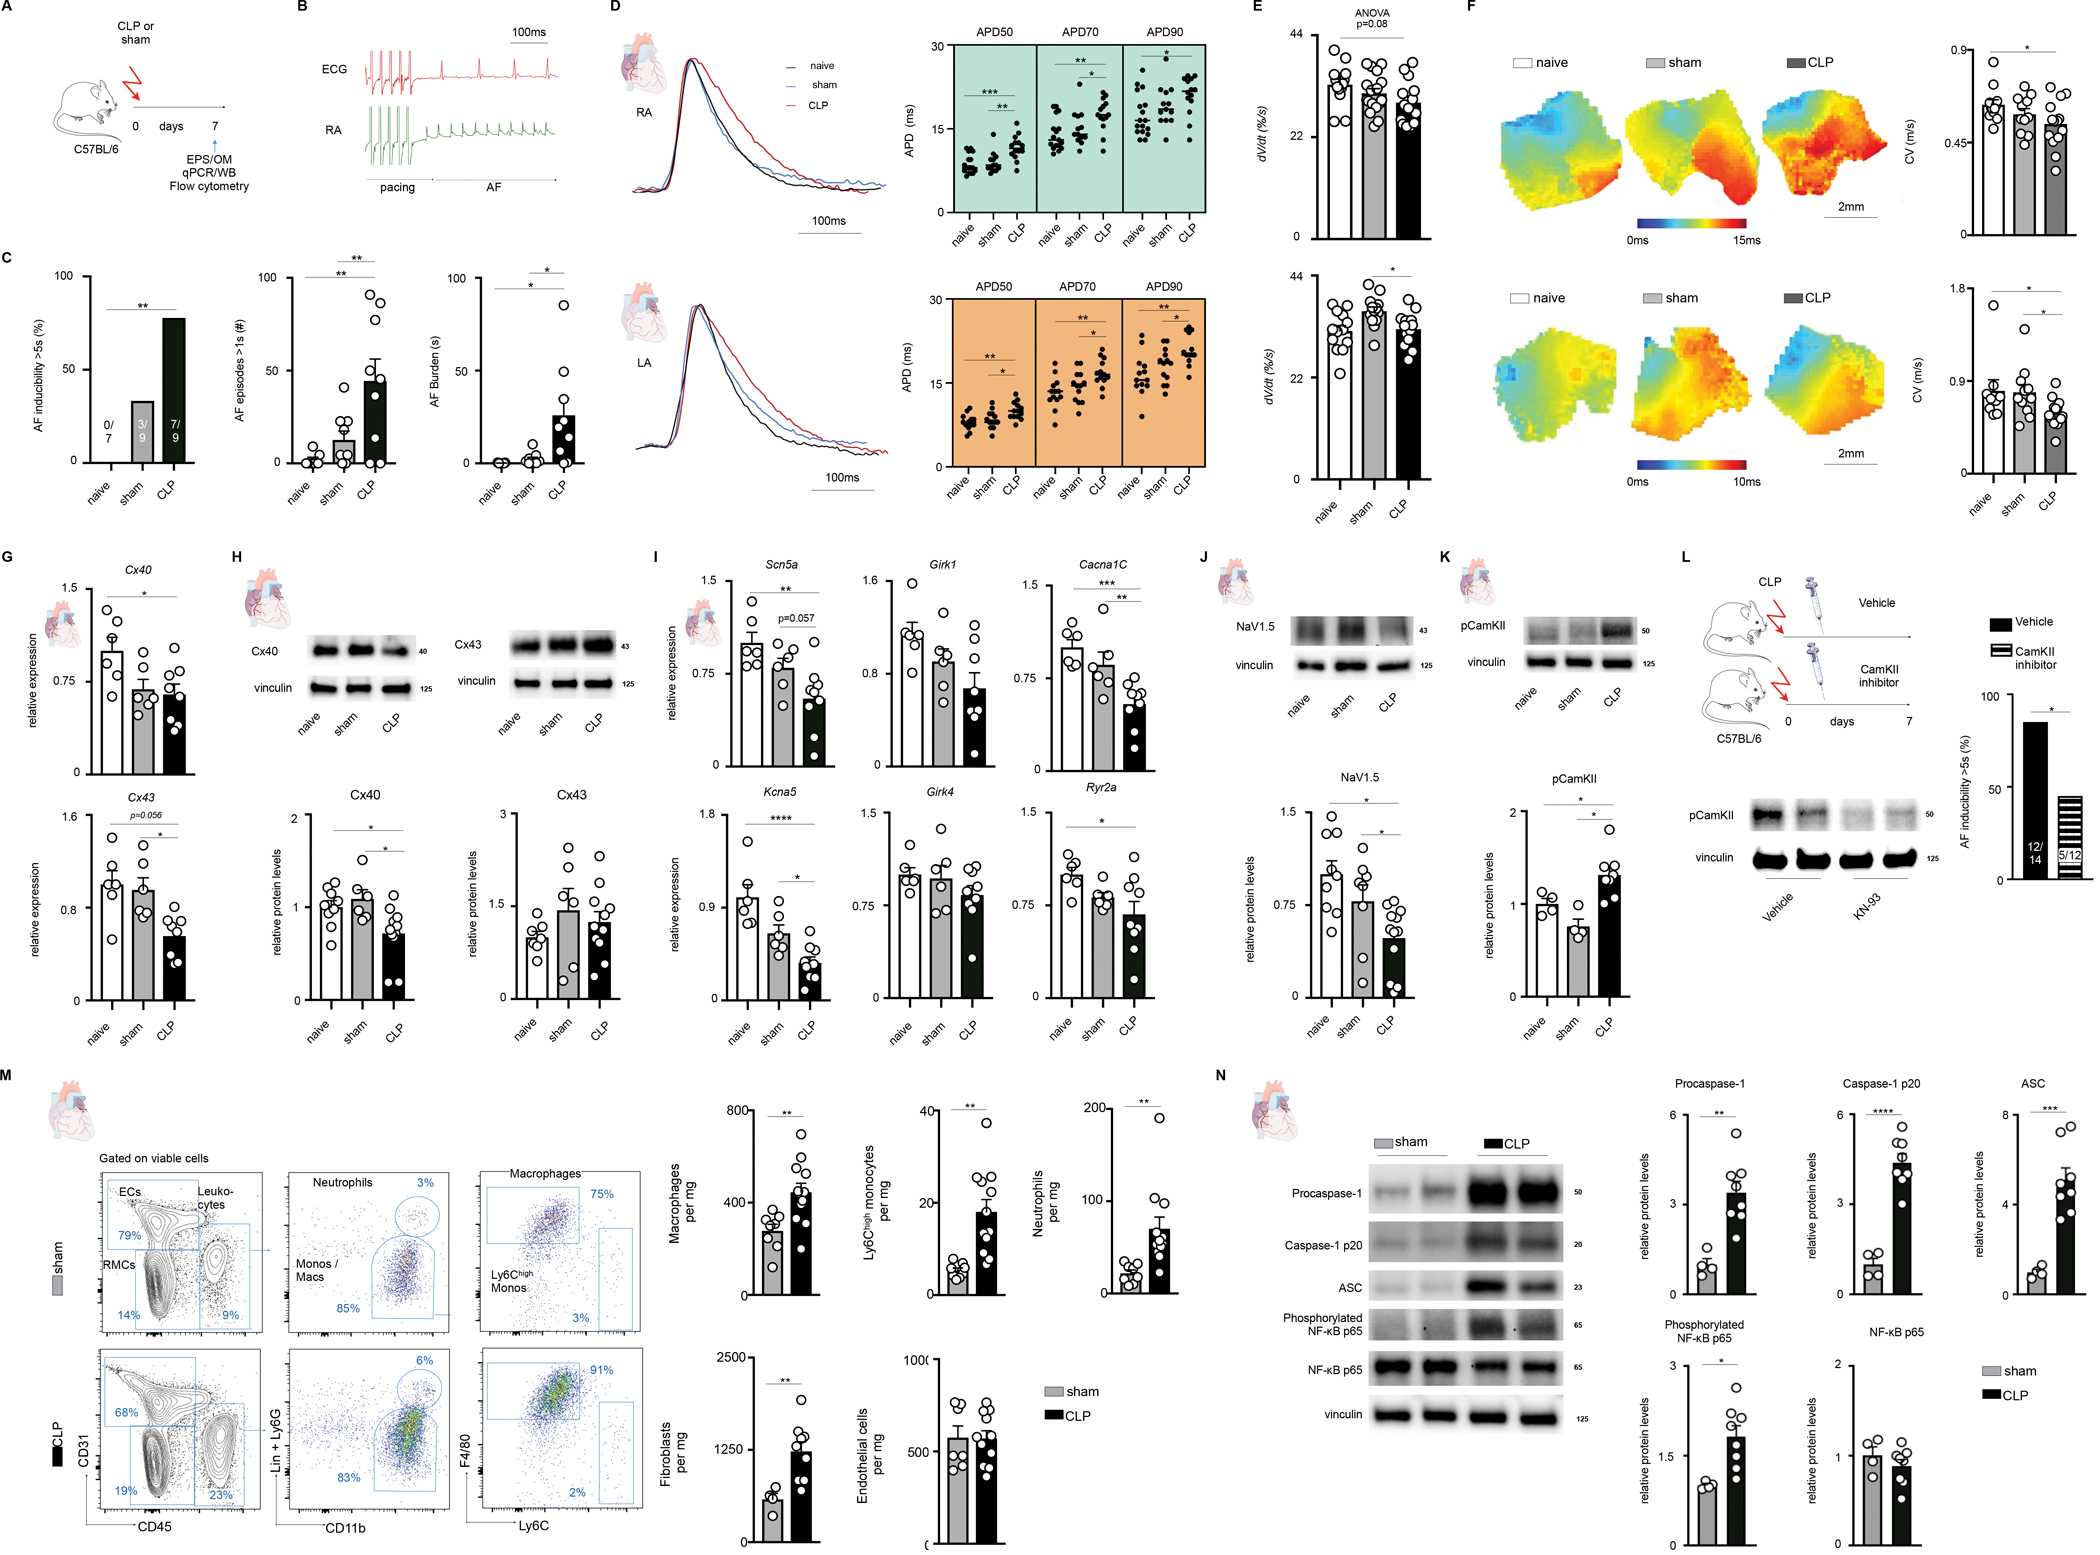
Figure. Cecal Ligation and Puncture Produces a Mouse Model of Atrial Fibrillation.

A, 57/Bl6 mice underwent mild cecal ligation and punction (CLP) or sham operation and were studied 7 days later. Naïve C57/Bl6 mice were used as additional controls.
B, Representative surface ECG and right atrial intracardiac electrogram acquired during an invasive EP study and showing pacing-induced AF.
C, Left, percentage of mice with an episode of atrial fibrillation (AF) longer than 5 seconds. Two-sided Fisher’s exact test. Middle, number of AF episodes longer than 1 second during the entirety of each EP study. One-way ANOVA, post-hoc Sidak test. Right, AF burden assessed per mouse during the entire EP study. One-way ANOVA, post-hoc Sidak test.
D, Left, representative action potential tracings derived from optical mapping in the right (upper) and left (lower) atrium 7 days after CLP. Right, quantification of the APD at 50%, 70%, and 90% repolarization; obtained at a pacing cycle length of 100ms. One-way ANOVA, post-hoc Sidak test.
E, Action potential upstroke velocity, (dV/dt) in the right (upper) and left (lower) atrium; obtained at a pacing cycle length of 100ms. One-way ANOVA, post-hoc Sidak test.
F, Optical mapping derived representative activation maps from right (upper) and left (lower) atria of mice with quantification of conduction velocity to the right; obtained at a pacing cycle length of 100ms. One-way ANOVA, post-hoc Sidak test.
G, Expression of atrial connexin genes measured by qPCR. One-way ANOVA, post-hoc Sidak test.
H, Representative blots of connexin 40 (left) and connexin 43 (right), with quantification below. One-way ANOVA, post-hoc Sidak test.
I, Atrial expression of ion channel genes measured by qPCR. One-way ANOVA, post-hoc Sidak test.
J, Representative blots of NaV1.5 sodium channel subunit with quantification shown below. One-way ANOVA, post-hoc Sidak test.
K, Representative blots of phosphorylated CaMKII with quantification shown below. One-way ANOVA, post-hoc Sidak test.
L, C57/Bl6 mice underwent CLP and then were treated with either vehicle or a CaMKII inhibitor, KN-93, every other day (total of 4 doses) until study (left upper). Left lower, representative blot showing decreased CaMKII phosphorylation in KN-93 treated mice. Right, percentage of mice with an episode of AF longer than 5 seconds in vehicle treated or KN-93 treated mice. Two-sided Fisher’s exact test.
M, Left, flow cytometry plots of the left atrium. Right, quantification of leukocytes, endothelial cells and fibroblasts in the left atrium. Up to 2 independent experiments. Two-tailed Student’s t-test.
N, Left, representative blots of protein expression in the atria. Right, quantification of relative protein expression in the atria. Two-tailed Student’s t-test.
Data are mean ± SEM with individual values for data distribution, *P<0.05, **P<0.01, ***P<0.001 and ****P<0.0001.
