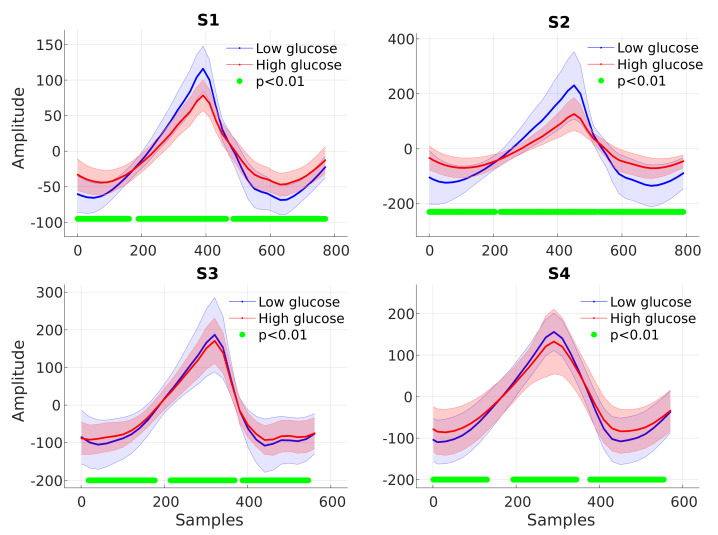
Figure 6.
Averaged low–glucose (blue) and high–glucose (red) PPG cycles with the corresponding shaded areas indicating the confidence intervals. The green dots designate time instances where the null hypothesis of no statistical difference between the low–glucose and high–glucose PPG cycles is rejected.

