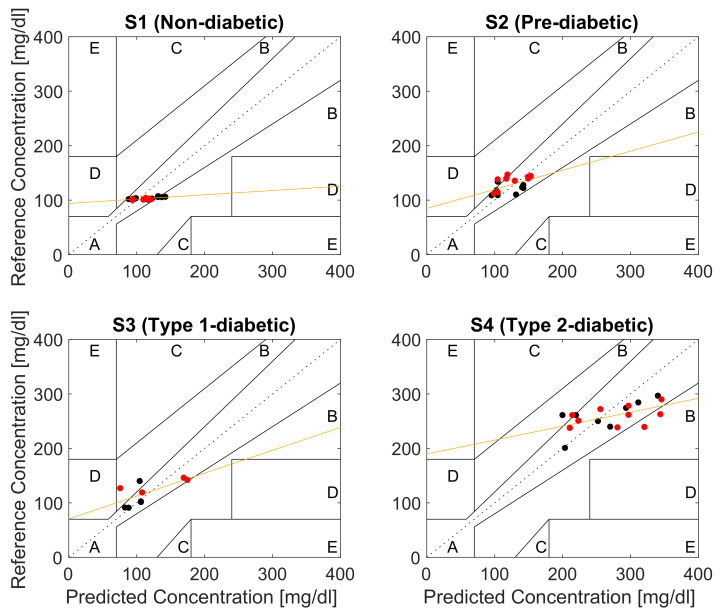
Figure 10.
Clarke error grid analysis (EGA) of the glucose predictions for a non-diabetic subject S1, pre-diabetic subject S2, type I diabetic subject S3, and type II diabetic subject S4 (black dots: Day 8 samples, red dots: Day 9 samples, orange line: linear least-squares regression of the reference versus the predicted glucose concentrations).

