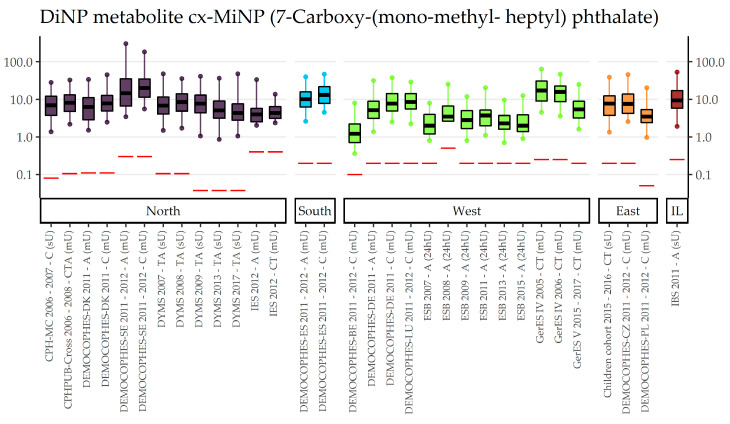
Figure 6.
DiNP metabolite cx-MiNP concentration in µg/L in boxplots. The box is based on P25, P50, and P75, and the whiskers are based on P5 and P95. Boxplots are presented separate by regions (North = violet, South = blue, West = green, East = orange, Israel = dark red); within regions they are chronologically sorted by year of sampling. Red lines denote LOQ/LOD for the respective study. Since percentiles are only available and displayed when they are above LOQ/LOD, the lower side of boxplots might be truncated. The age categories are shown in capital letters: children of the age groups 3–5 and 6–11 (C), adolescents between 12 and 19 years (T) and adults from the age groups 20–39, 40–59 and 60 years and older (A). The sampling method is indicated in brackets: first morning urine void (mU), spot urine (sU) and 24-h urine (24hU).

