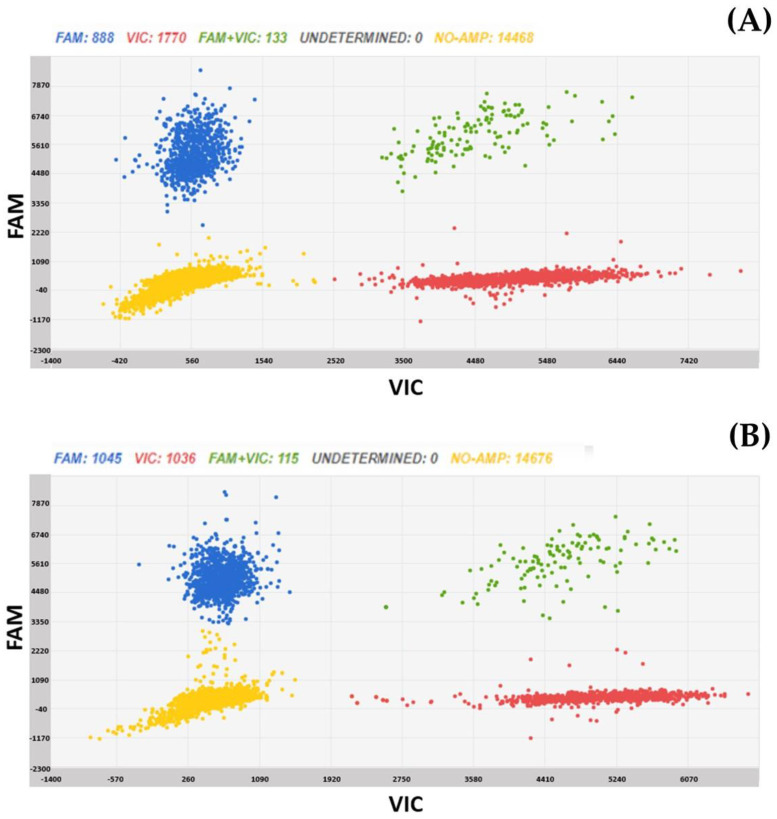
Figure 6.
Chip digital PCR scatter plots of Solina 1 (A) and of Solina 2 (B) samples, carrying, respectively two and one copy of vrn-A1 gene. Blue dots are chip wells in which Pinb-D1 gene (marked with FAM) has been amplified, red dots are wells in which vrn-A1 gene (marked with VIC) has been amplified, green dots are wells in which both genes have been amplified, whereas yellow dots are wells without any amplification. From raw data, the software calculates the number of copies/µL of each gene. The ratio between vrn-A1 copies and Pinb-D1 copies is 1.9 for Solina 1 and 1 for Solina 2.

