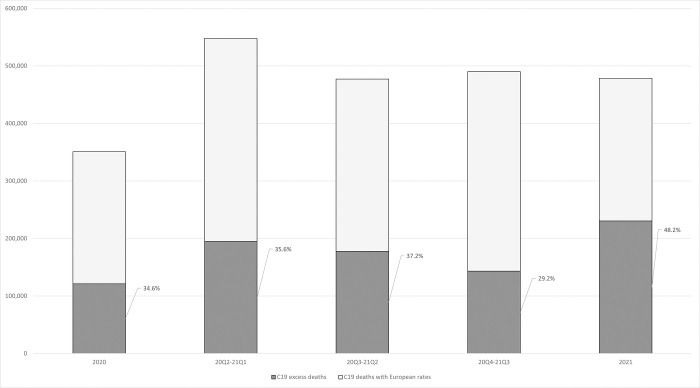
Fig 1. Number of US deaths attributed to Covid-19 by 12-month period and proportion of Covid-19 deaths that are excess deaths (in percent).
Deaths attributed to Covid-19 are shown as the sum of Covid-19 deaths estimated by applying the population-weighted average of the European death rates from Covid-19 to the US population (light grey) and the excess deaths from Covid-19 (dark grey),.The first (left) and last (right) periods are calendar years. The three intermediate 12-month period are shifted by one quarter each: i.e., 20Q2-21Q1 refers to the period from April 1st, 2020, to April 1st, 2021.

