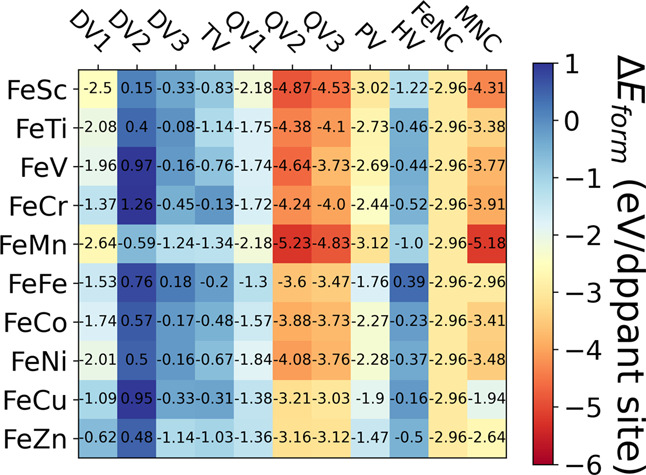
Figure 2.

Formation energy (ΔEform) heatmap of the different metal dimer combinations on different vacancy sites as shown in Figure 1. The formation energy values for the corresponding single metal dopants are also shown here. The calculation details for the formation energies are given in Section S-II of the SI. The color map shows the relative stability in eV/dopant site. The metal combinations are denoted as FeM, where M corresponds to the first-row transition metal atoms from Sc to Zn. FeNC and MNC corresponds to the respective SACs.
