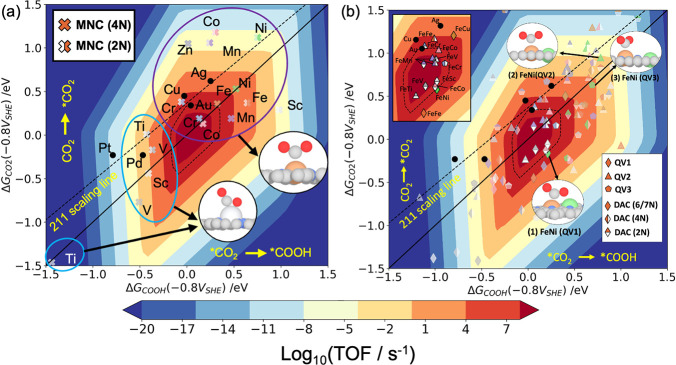
Figure 3.
Activity volcano plots for SACs and DACs plotted using the binding energies of CO2* and COOH* as the activity descriptors at an applied potential −0.8 V vs SHE and pH of 6.8. (a) Unified activity of SACs with first row transition metals doped on the defected graphene layer with 2 and 4 surrounding coordinating N atoms. The early and late transition metal dopants prefer different binding motifs as shown in the inset of the figure. (b) The activity of FeM DACs doped on the three quad-atom vacancy sites (QV1, QV2, and QV3) for 2, 4, and 6/7 coordinating N atoms is shown. The metal dimers with TOF comparable to or greater than the Au (211) surface and lower surface coverage for CO are mainly highlighted in solid markers. The less active materials are shown in faded markers. The top-left panel of Figure 3b shows the chemical symbols of the metal dimers activity comparable to or greater than the Au (211) surface and those reported in recent experimental studies. The black dotted curve denotes the rate map for the Au (211) surface.

