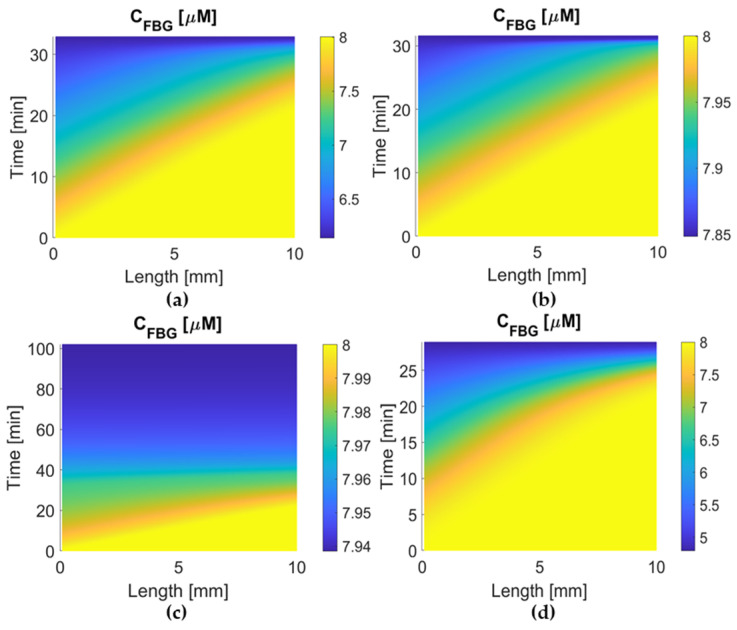
Figure 6.
Temporal and spatial concentration profiles of free-phase fibrinogen for (a) alteplase, (b) tenecteplase, (c) reteplase, and (d) urokinase in the clot. Free-phase FBG concentration in the clot (lower concentration represents higher ICH risk): urokinase < alteplase < tenecteplase < reteplase.

