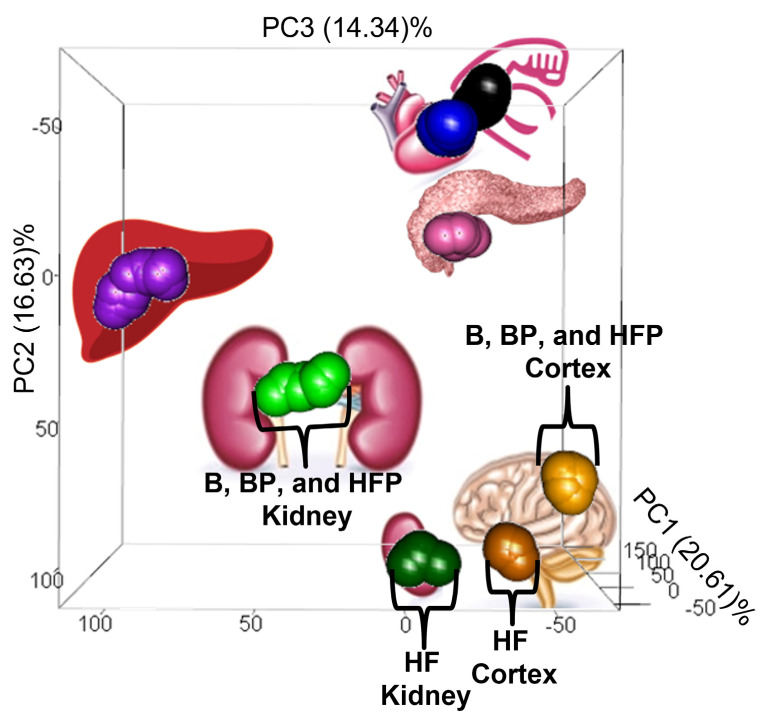
Figure 1.
PCA plot of all derived pig tissue metabolomes. A total of 20 pigs were distributed equally into 4 distinct dietary cohorts (a nutritionally balanced basal cohort, a higher-fat obesogenic cohort, a basal cohort supplemented with probiotics, and a higher-fat cohort supplemented with probiotics). A PCA compared the metabolomes, and a three-dimensional plot of the results reveals how the pig tissue metabolomes are distinguished from each other (that is, the samples distinctly cluster by tissue type in the plot). Each sphere in the plot reflects the metabolome of one pig tissue sample and is color-coded by tissue type (liver: purple, kidney: green, heart: blue, skeletal muscle: black, pancreas: pink, and brain cortex: orange). For emphasis, the kidney samples obtained from the higher-fat pig cohort are colored dark green, and the higher-fat brain cortex samples are colored dark orange (they are also denoted as HF in the plot). This PCA plot demonstrates that, regardless of dietary cohort, the heart, skeletal muscle, pancreas, and liver samples cluster by tissue type. In contrast, the kidney and brain cortex samples obtained from pigs fed a higher-fat diet segregate away from the same tissues obtained from the basal, basal+probiotic, and higher-fat+probiotic cohorts (for emphasis, these are labeled as B, BP, and HFP in the plot), suggesting that these tissues undergo a more significant change in response to a higher-fat diet. These changes, however, appear to revert with probiotic supplementation.

