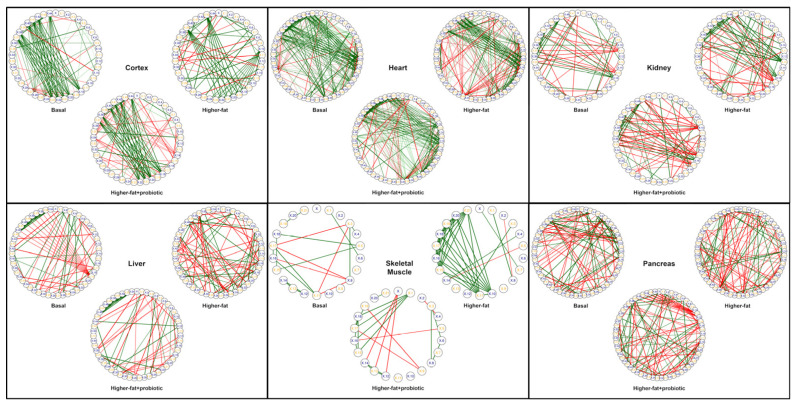
Figure 3.
Tissue-specific metabolite correlation networks of the basal, higher-fat, and higher-fat+probiotic cohorts. For each tissue type, Pearson’s correlation coefficients were calculated for metabolites present in a minimum of 3 of 5 pigs in any one of the three pig cohorts, and only those metabolites common to all three cohorts were included in the network. Positive Pearson correlation values, r ≥ 0.90, are depicted as a green line between metabolites, whereas negative correlations, r ≤ −0.90, are depicted as a red line between metabolites. To facilitate visual comparison of the networks, metabolites are represented as a small, alpha-numerically labeled circle, and their placement around the circumference of each network is fixed among the plots for each tissue. For all tissues, comparison of the metabolite correlation networks (i.e., metabotype) indicates that probiotic supplementation of the higher-fat diet alters the metabolome relative to the higher-fat diet alone, and particularly within the brain cortex, heart, and kidney, probiotic supplementation changes the higher-fat metabolome in a manner that appears similar to the metabotype associated with the basal diet.

