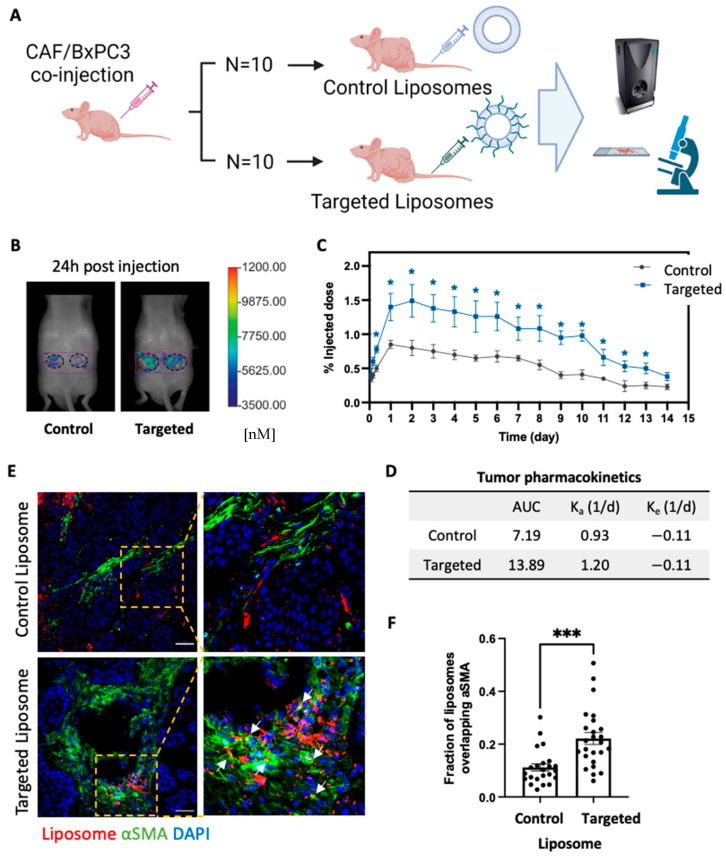
Figure 4.
In vivo imaging of CAF-targeted liposomes. (A) Schematic of mouse study design. (B) FMT images of mice at 24 h post-liposome injection. (C) Mice bearing subcutaneous admix CAF/BXPC3 tumors (n = 10 tumors/group) were injected with dye-labeled liposomes, and the tumor accumulation was measured on an FMT using a region-of-interest around the tumor area. Statistical significance was measured with a Student’s t-test between targeted and control liposomes. * p < 0.05. (D) Tumor pharmacokinetics were determined by fitting the liposome time course data with compartment models by regression analysis in MATLAB. (E) Immunofluorescence images of tumor sections from mice injected with liposomes with and without HTTIPKV. The lipophilic dye shows the location of liposomes (red); cells were stained to show nuclei (DAPI, blue) and α-SMA-positive cells (green). Arrows indicate co-localization. Scale bars, 50 µm. (F) Mander’s colocalization analysis of injected liposomes overlapping with αSMA-positive cells in the admix tumor section at 24 h post liposome injection. n = 7~9 images/mouse, 3 mice/group. *** p = 0.0002.

