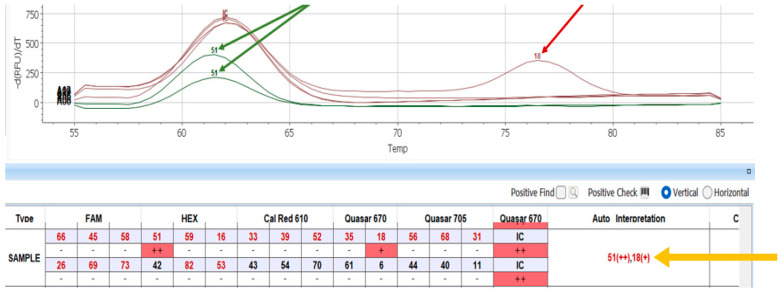
Figure 6.
Analysis of genotype, viral load and coinfections of HPV samples as detected by melting curve analysis. In box “Auto Interpretation”, indicated by yellow arrow, the analysis data for each HPV sample are reported. The selected sample has co-infection (HPV51 and HPV 18), each with a different viral load values indicated with + symbols. Viral load evaluation is semi-quantitative and is based on the number of melting curve florescence detections: the greater the number of detections, the greater the viral load value, and it is reported as ++ or + or − (if not detected).

