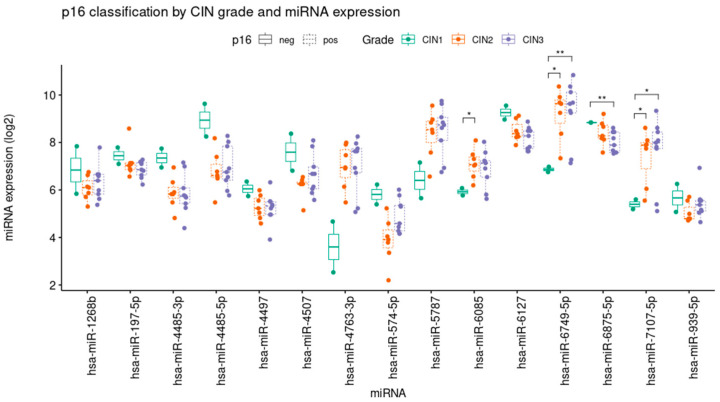
Figure 8.
Expression levels of the 15 deregulated miRNA classified for CIN level and p16. miR-6085, miR 6749-5p, miR 6875-5p and miR-7107-5p differences in positive p16 and negative p16 are statistically significant. Histograms depicts the quantitative data of means + SE of positive p16, p < 0.05 vs. p16 negative samples. * p < 0.5, ** p < 0.05.

