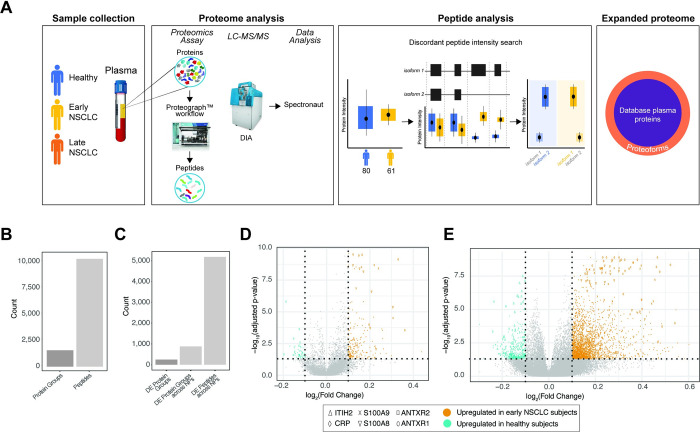
Fig 1. Proteome analysis of healthy and NSCLC subjects using a 5 NP plasma workflow.
A. Overview of this proof-of-concept proteoform identification study. Plasma samples were collected from healthy (blue), early non-small cell lung cancer (NSCLC; yellow), late NSCLC (orange), and co-morbid (green) subjects (Sample Collection). The plasma proteomes were analyzed for each of these subjects, which included protein extraction, protein discovery using the NP-based Proteograph platform, then DIA protein/peptide identification and quantification using LC-MS/MS and search algorithms (Proteome Analysis). Proteoforms were then identified using a discordant peptide intensity search, which included examining peptide mappings to known protein coding isoforms and using differential abundance to discover protein isoforms. Together, these identified proteoforms represent an expanded plasma proteome database not captured in standard MS-based or targeted proteomic studies (Expanded proteome). B. Barplots showing the number of peptides and proteins groups retained after filtering to those present in at least 50% of subjects from either heathy or early NSCLC. C. Barplots showing the number of differentially abundant (DA): 1) protein groups, with collapsed abundances using MaxLFQ; 2) protein groups across NPs (i.e., DA independently across NPs); and 3) peptides across NPs. D. Volcano plot showing the significance (adjusted p-value; y-axis) and fold change (x-axis) from calculating the differential abundance of protein groups across NPs between healthy and early NSCLC subjects. Protein groups with a log2(Fold Change) greater or less than 1.0 and adjusted p-value < 0.05 are highlighted, where protein groups with increased abundance in early NSCLC subjects are shown in orange and protein groups with increased abundance in healthy subjects are shown in teal. Proteins with known roles in cancer and immune response (ITIH2, CRP, S100A9, S100A8, ANTXR2, and ANTXR1) are highlighted with various shapes. E. Volcano plot showing the significance (adjusted p-value; y-axis) and fold change (x-axis) from calculating the differential abundance of peptides across NPs between healthy and early NSCLC subjects. Peptides with a log2(Fold Change) greater or less than 1.0 and adjusted p-value < 0.05 are highlighted, where peptides with increased abundance in early NSCLC subjects are shown in orange and peptides with increased abundance in healthy subjects are shown in teal. Peptides mapping to proteins with known roles in cancer and immune response (ITIH2, CRP, S100A9, S100A8, ANTXR2, and ANTXR1) are highlighted with various shapes.

