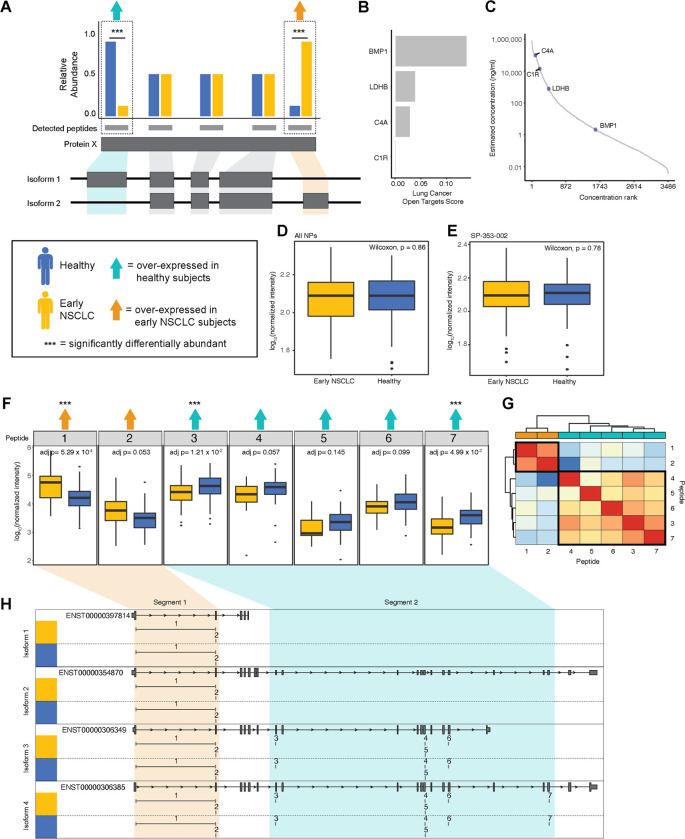
Fig 2. Identification of four proteoforms, including BMP1, in 141 healthy and early NSCLC subjects using a discordant peptide intensity search.
A. Cartoon describing the discordant peptide intensity search strategy. We calculated DA across peptides between healthy (blue) and early NSCLC (yellow). Protein groups with at least one peptide significantly over-expressed (triple asterisks) in healthy subjects (teal arrow) and at least one peptide over-expressed in early NSCLC subjects (orange arrow) were identified as having putative proteoforms. Mapping the peptides to the gene structure, we inferred potential exon usage and segments suggesting the detection of more than one protein isoform. B. Barplot showing four proteins in which we potentially captured multiple protein isoforms: BMP1, C4A, C1R, and LDHB and their associated Open Target Score for lung carcinoma. C. Plot showing the four proteins with putative proteoforms matched to a reference database (HPPP) plotted as a distribution by the rank order of published concentrations (x-axis) and by the log10 published concentration (ng/ml; y-axis). D. Box plot showing the log10 median normalized intensities of BMP1 in early NSCLC subjects (yellow) and in healthy subjects (blue) with collapsed abundances across NPs. P-values, calculated using a Wilcoxon test, are shown. E. Box plot showing the log10 median normalized intensities of BMP1 in early NSCLC subjects (yellow) and in healthy subjects (blue) in NP, SP-353-002. P-values, calculated using a Wilcoxon test, are shown. F. Series of boxplots showing the log10 median normalized intensities of seven peptides mapping BMP1 in early NSCLC (yellow) and healthy subjects (blue). Peptides that are over-expressed in healthy subjects are indicated with a teal arrow and in early NSCLC are indicated with an orange arrow. Peptides that are significantly DA are indicated with a triple asterisk. P-values, calculated using a Wilcoxon test and adjusted, are shown. G. Heatmap showing the Pearson correlation of the seven BMP1 peptide abundances, where low correlation is indicated in shades of blue and high correlation is indicated in shades of red. Correlation values were clustered using hierarchical clustering. Peptides are annotated by the direction of DA, including over-expressed in healthy subjects are highlighted in teal and early NSCLC are highlighted in orange. H. Gene structure plots of four known BMP1 protein coding transcripts (i.e., isoforms) with the seven BMP1 peptides mapped to genomic region. Peptides spanning intronic regions are indicated with a horizontal line. Peptides 1 and 2, corresponding to being over-expressed early NSCLC, are boxed in orange, creating one segment. Peptides 37, corresponding to being over-expressed healthy, are boxed in teal, creating a second segment. Segment 1 appears to correspond to the shorter isoform 1, whereas segment 2 appears to correspond to the longer isoforms 2–4.

