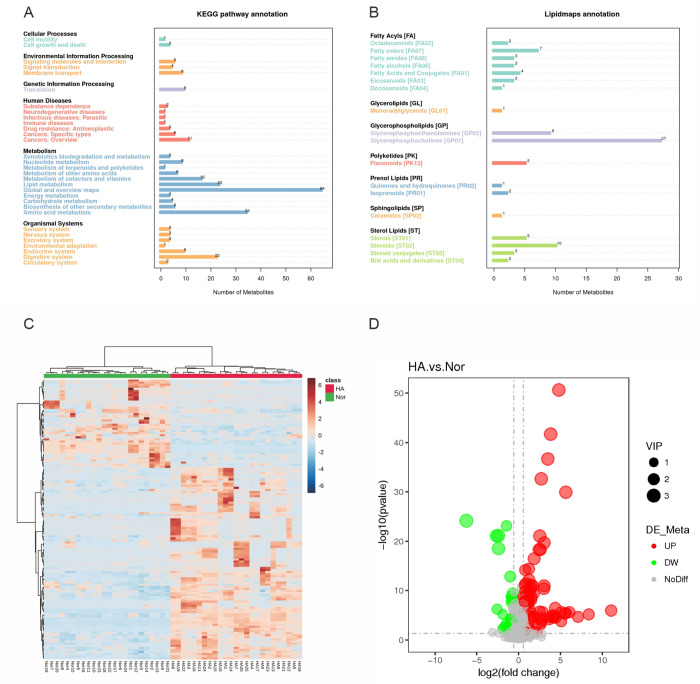
Fig 3. Annotation and screening of metabolites.
Annotation of metabolite pathway results based on KEGG (A) and Lipidmaps (B). Heat map of the differential metabolites between Nor and HA groups (C). The volcano plot of the metabolites, red points represent up-regulated metabolites and green point represented down-regulated metabolites (D).

