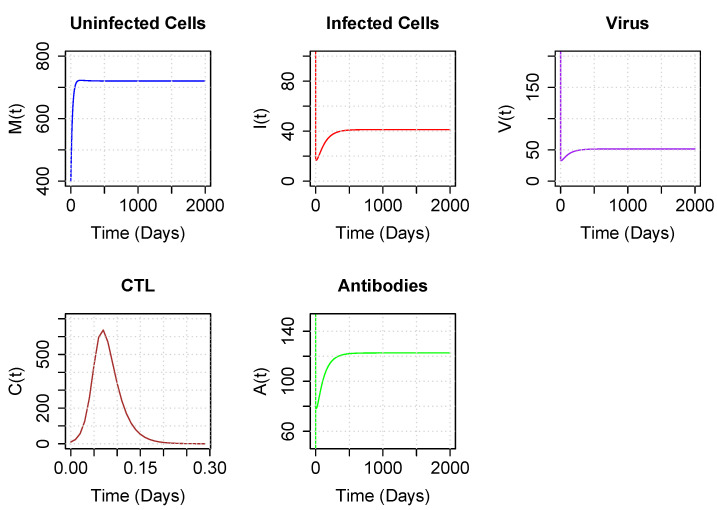
Figure 6.
Trajectory plots of populations for parameters corresponding to the boundary region below the upper branch of the hyperbola. Parameter values are set to sample values of Table 1, with and . Initial conditions are , , , and . Note the very brief time scale for quickly converging to 0 (under one day).

