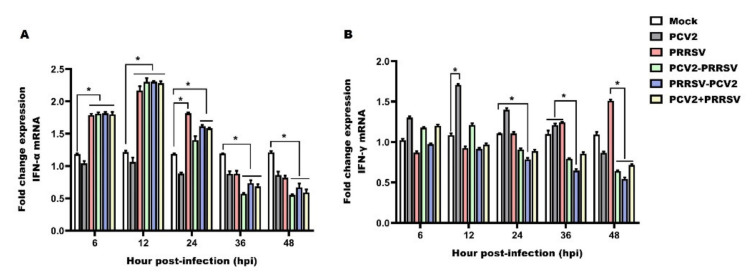
Figure 4.
Relative mRNA expression of IFN-α and IFN-γ. PAMs in the PCV2 alone group (PCV2), the PRRSV alone group (PRRSV) and the PCV2 and PRRSV co-infected groups (PCV2–PRRSV, PRRSV–PCV2 and PCV2 + PRRSV) were inoculated with PRRSV or/and PCV2 at a MOI of 1, respectively. PAMs in the mock group were inoculated with equal RPMI-1640 medium. Then, PAMs from these groups were collected at 6 h, 12 h, 24 h, 36 h and 48 h post-infection, respectively. RT-qPCR analysis of IFN-α (A) and IFN-γ (B) mRNAs in PAMs from different groups. Data are expressed as means ± SD of three independent experiments. Significant differences between groups are represented (* p < 0.05).

