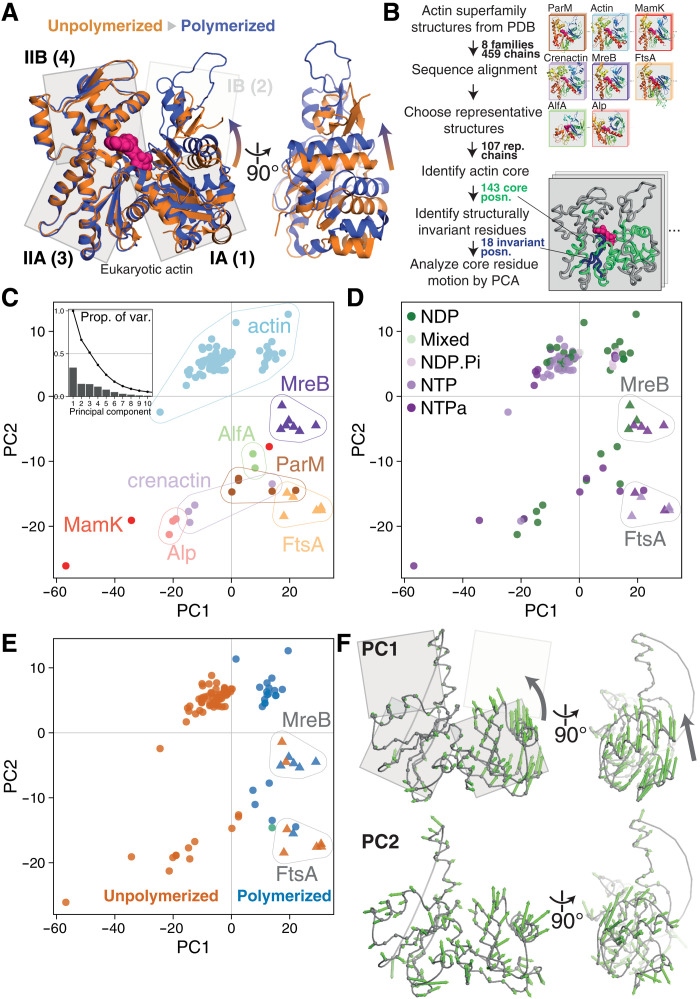
Fig. 2. Conformational analysis of actin superfamily structures reveals a conserved subunit switch upon polymerization.
(A) Inspection of eukaryotic actin subunit structures in unpolymerized (PDB 3EL2, orange) and polymerized (actin-tropomyosin, 5JLF, blue) states reveals the previously characterized actin “propeller twist” conformational change. (B) Pipeline for PCA of conformational changes across the actin superfamily. Bottom right inset: Example structure with identified actin core positions (green) and structurally invariant core (blue). (C) Results of PCA. Representative structures [colored by subfamily, triangles mark FtsA/MreB structures in (C) to (E)] are plotted in PC1-PC2 subspace. PC2 mostly describes the differences between subfamilies, with further contributions from PC3 (fig. S1). Inset: Proportion of variance explained by each component. (D) Identical to (C), but structures are colored by the hydrolysis state of the bound nucleotide (NTPa, less/nonhydrolyzable nucleotide triphosphate analog). (E) Identical to (C) and (D), but structures are colored by polymerization state (unpolymerized in orange, polymerized in blue; green: PDB 4A62, ParM:ParR, discussed in text S1). PC1 mostly describes the polymerization state of subunits, with exception of the MreB and FtsA subfamilies (triangles), which form noncytomotive filaments. (F) Per-position PC loading vectors (green arrows) for PC1 and PC2 are visualized on a representative actin core [see scheme in (B) and Materials and Methods]. Both views as in (A).

