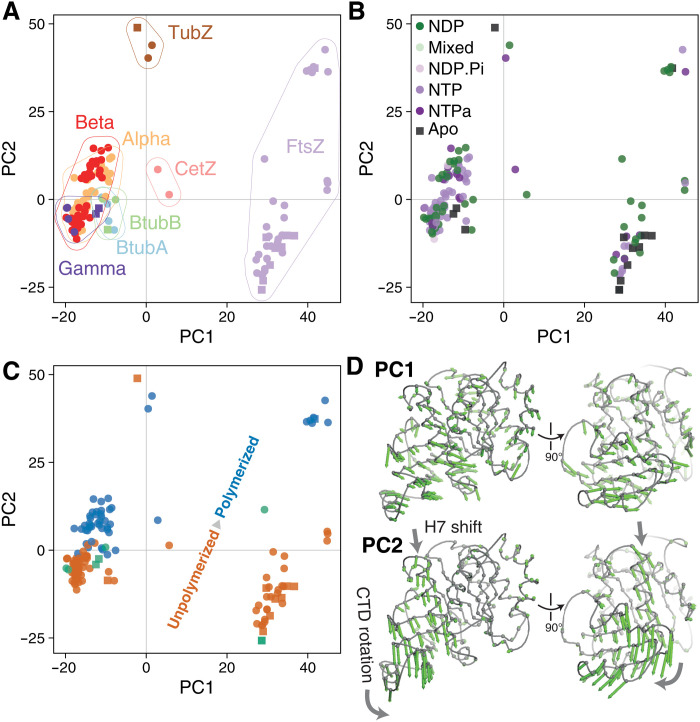
Fig. 5. Conformational analysis of tubulin superfamily structures reveals a conserved subunit switch upon assembly.
(A) Results of PCA. Representative tubulin structures plotted in PC1-PC2 subspace, colored by tubulin subfamily. PC1 mostly describes differences between subfamilies. (B) As (A), but structures/points are colored by nucleotide hydrolysis state. (C) As (A) and (B), but structures/points are colored by assembly state [unpolymerized, orange; polymerized, blue; “special/ambiguous,” green (more details in text S1)]. PC2 mostly describes the assembly state. (D) Per-position PC loading vectors for PC1 and PC2 (green arrows) are visualized on a representative tubulin core (see Materials and Methods).

