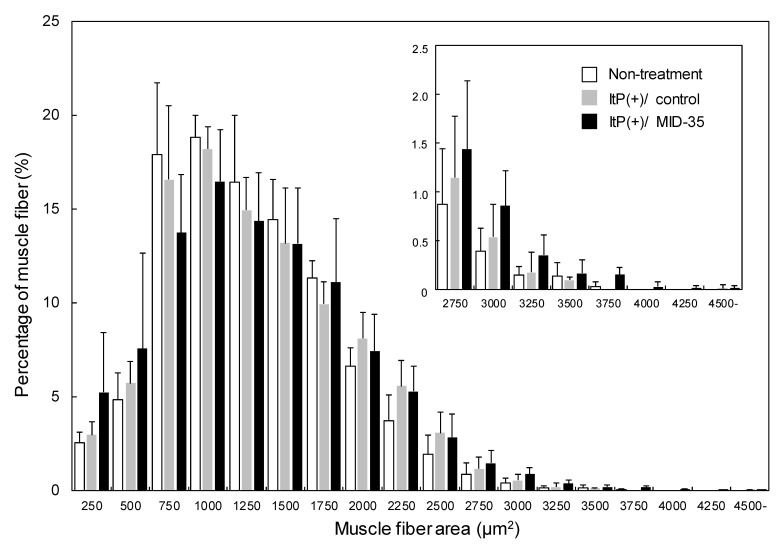
Figure 5.
Analysis of the distribution of muscle fiber cross-sectional areas after delivery of MID-35 by ItP: The percentages of muscle fiber having the noted sizes from the analysis in Figure 4 were calculated. The columns of white, gray and black are the cross-sectional areas of muscle collected from non-treated mice (Non-treatment), control ItP/PBS-treated mice (ItP(+)/control) and ItP/MID-35-treated mice (ItP(+)/MID-35), respectively. The values are shown as means ± SD obtained from five different images of muscle cross-sections.

