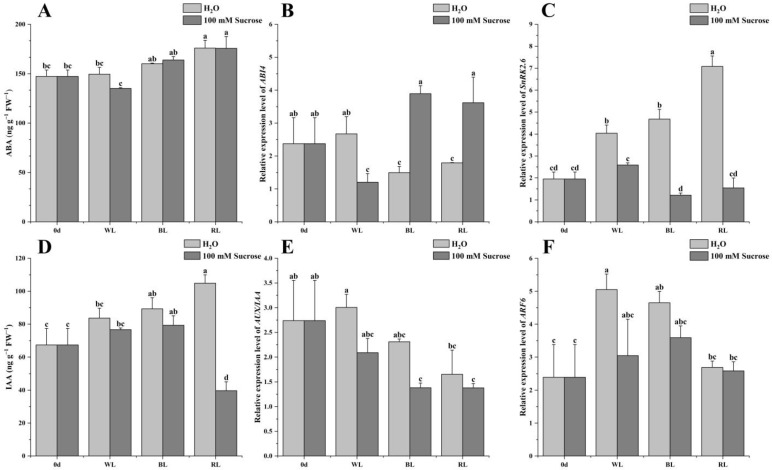
Figure 5.
Effect of light quality and sucrose on ABA and IAA signaling. (A) ABA content, (B) ABI4 expression level, (C) SnRK2.6 expression level, (D) IAA content, (E) AUX/IAA11 expression level, (F) ARF6 expression level. Data represent the means ± standard error (n = 3). Different lowercase letters indicate the statistically significant difference of the mean values based on one-way analysis of variance (ANOVA) followed by Duncan’s multiple range test (p ≤ 0.05).

