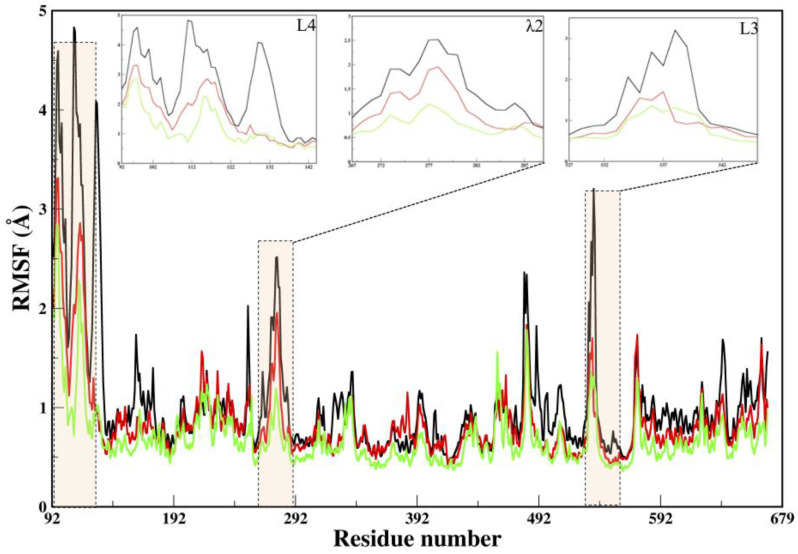
Figure 2.
Dynamical characteristics of the Cα atomic fluctuation, represented by RMSF of different systems elucidated through conventional MD simulations. The regions L4, λ2, and L3, showing significant fluctuations, are highlighted in transparent bars. The insets of these regions are shown, to highlight the differences in fluctuation. The color coding of systems is as follows: black (APO), green (COM1), and red (COM2).

