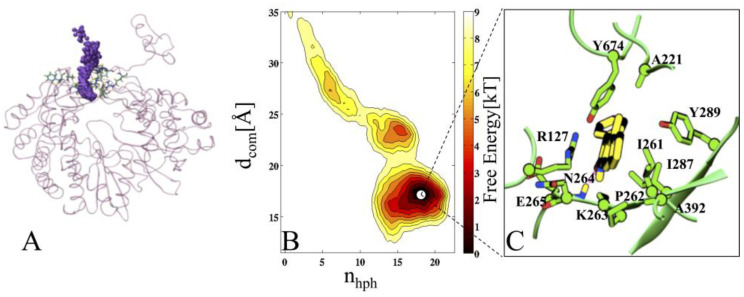
Figure 6.
Characterization of 5m unbinding during metadynamics simulation. (A) The starting state of 5m. (B) The two-dimensional free-energy surface (FES) of 5m in COM2, and its dissection according to the minima obtained during the unbinding process. Each color and each line of FES correspond to 1 kcal/mol. (C) Conformation representing the state of 5m in COM2, enlarged from mini-1. The FES of 2h is ~10 kcal/mol. The free energy is contoured in steps of 2 kcal/mol up to 10 kcal/mol. In panel (C), the inhibitor 2h is represented in yellow, and residues acids are shown in green. The red dotted line represents the HB between residues and 5m.Gb.

