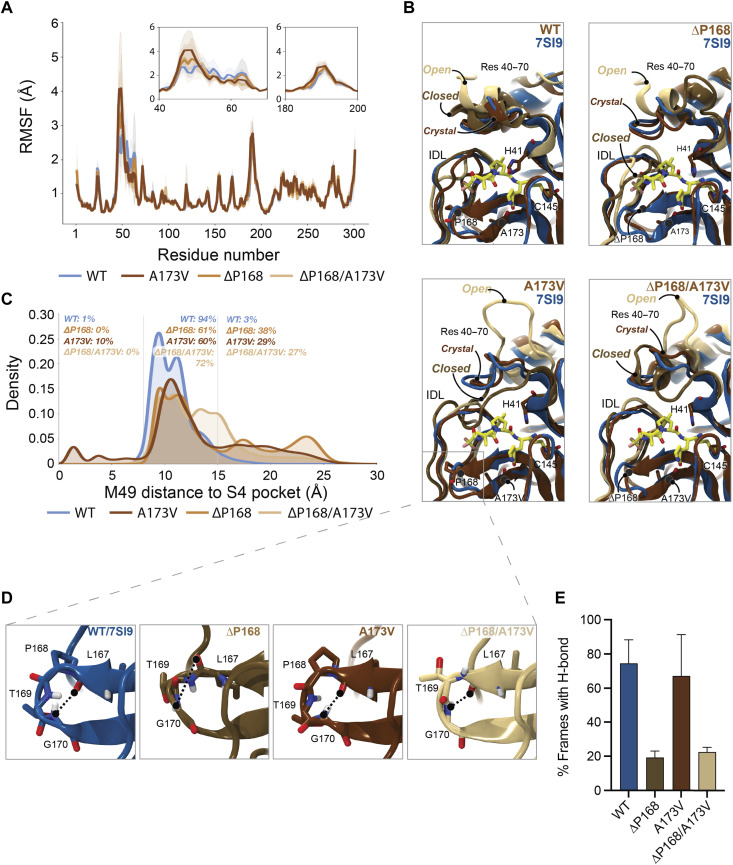
Fig. 4. Structural interpretation of Mpro ∆P168/A173V synergistic resistance to nirmatrelvir.
(A) RMSFs calculated per residue for each simulated Mpro variant. To maintain numbering consistency, RMSFs for deleted residues are plotted as the interpolation of values from the prior residue (167) and the following residue (169). Calculated RMSFs per residue were averaged over all replicas and across chains A and B. Inset plots highlight increased flexibility of regions 40 to 70 and 180 to 200. (B) Molecular model images demonstrating the flexibility of residues 40 to 70 and 180 to 200 captured in simulations of WT, ΔP168, A173V, and ΔP168/A173V. All MD frames were aligned to the 7SI9 crystal structure (blue ribbons) to highlight the nirmatrelvir (carbon atoms represented in yellow licorice) binding site. MD simulation frames, in crystal, closed, and open conformations, are represented in chocolate brown, golden brown, and latte brown ribbons, respectively. (C) Histograms demonstrating the distribution of frames for which M49 penetrates the S4 subpocket and the distribution of frames for which M49 (and thus residues 43 to 53) moves far above Mpro’s native binding grove. (D) Molecular model images demonstrating the binding site β-hairpin structure (residues 165 to 175) as seen in WT (blue ribbons), ΔP168 (golden brown), A173V (chocolate brown), and ΔP168/A173V (latte brown) MD frames. Hydrogen bonds, or lack thereof, between L167 backbone carbonyl and G170 backbone nitrogen are highlighted. (E) Percentage of frames calculated in which the L167-G170 backbone hydrogen bond is observed. Hydrogen bond requirements were established as <4 Å between L167 backbone carbonyl oxygen and G170 backbone nitrogen, and an angle of >120° between L167 backbone carbonyl oxygen, G170 backbone hydrogen, and G170 backbone nitrogen (see results for complete characterization). Percentages were calculated and averaged per replica and per chain, and SDs were used as error estimates.

