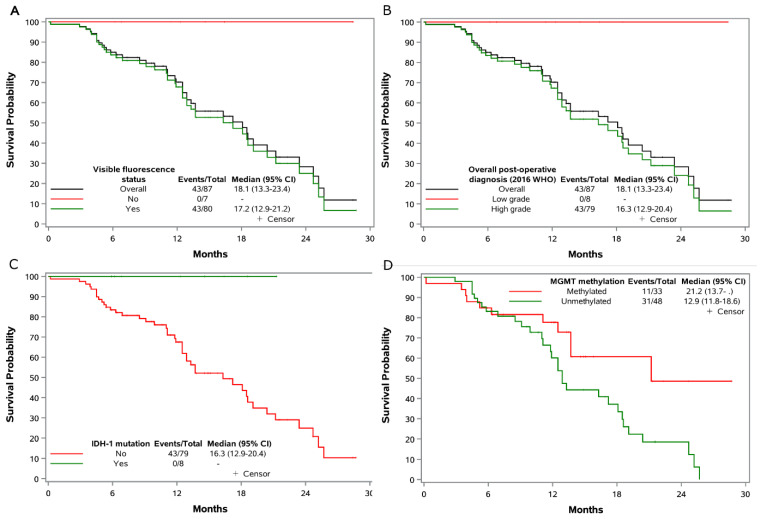
Figure 4.
Overall survival in the eligible patients. Shown are Kaplan–Meier curves for overall survival. Tick marks indicate censored data. The survival time calculate from date of registration to date of death, censored if alive or lost to follow-up. (A) Overall survival of overall population and stratified by visible fluorescence; (B) Overall survival of overall population and stratified by post-operative diagnosis (2016 WHO); (C) Overall survival stratified by IDH-1 mutation status; (D) Overall survival stratified by MGMT methylation status. Two patients optout from study, the MGMT methylation status was not available for 6 patients.

