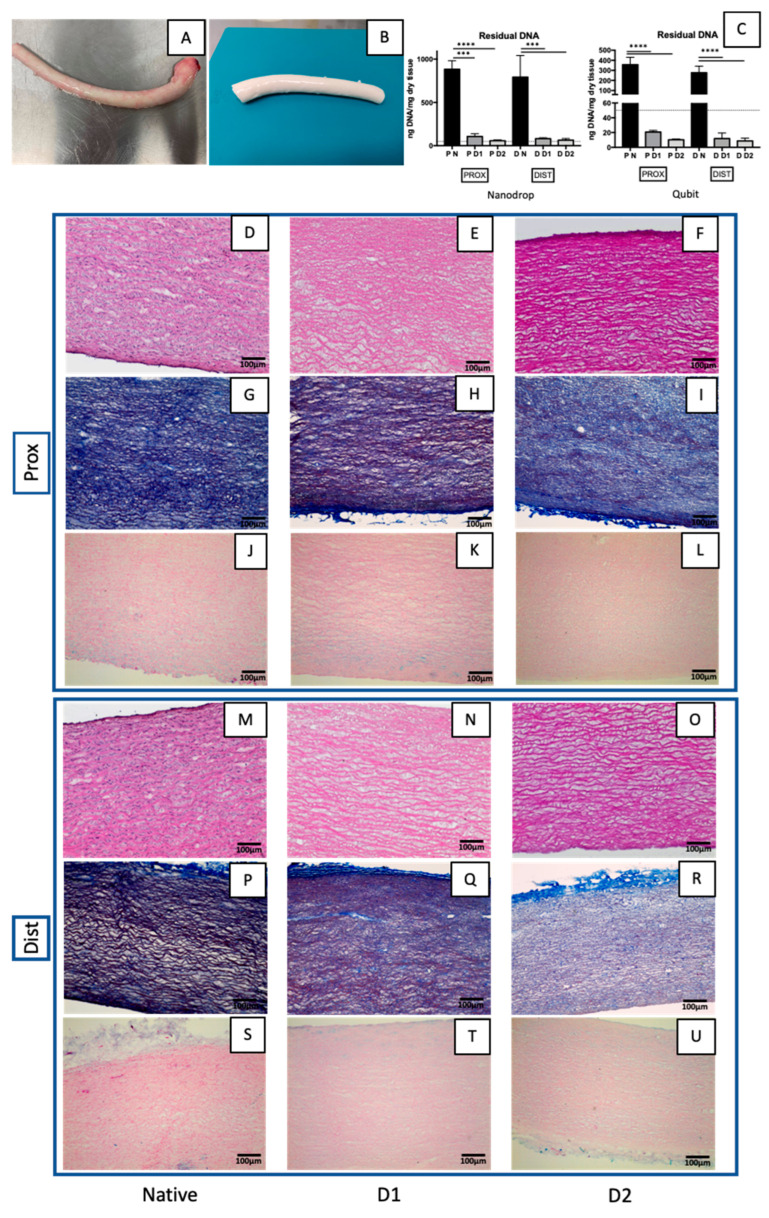
Figure 2.
Descending aorta before (A) and after decellularization (B). DNA quantification (C) made in native and decellularized descending aortas using D1 and D2: with NanoDrop on the left and with Qubit on the right. Data on graphs display the mean ± SD. Data were analysed by t-test. **** p < 0.0001 and *** p < 0.001. Histological analyses of native and decellularized descending aortas with D1 and D2: haematoxylin and eosin staining illustrates the successful nuclei elimination in decellularized tissue (D–F,M–O). Collagen and elastic fibres are revealed by Masson’s trichrome (G–I,P–R). Alcian blue shows the presence of glycoproteins (J–L,S–U).

