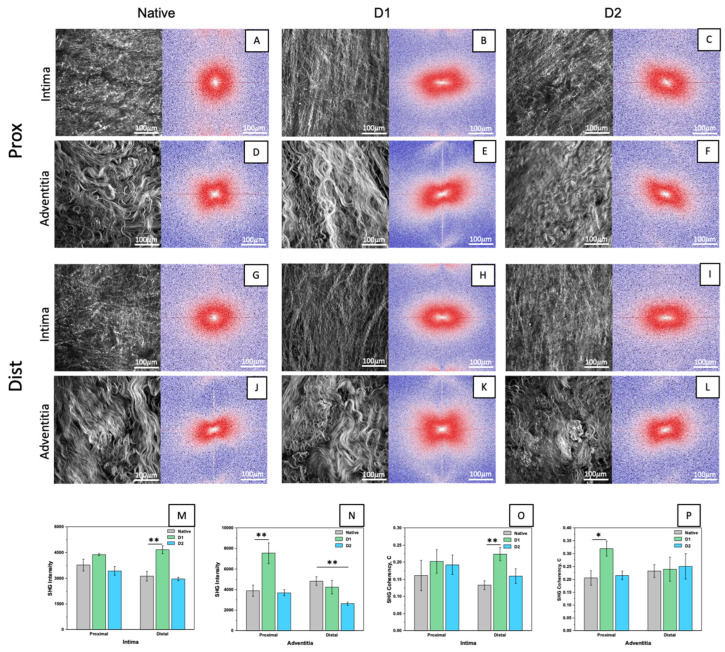
Figure 4.
Z–stack of max intensity of phase contrast of native and decellularized descending aortas with D1 and D2 in proximal and distal regions and demonstrative FFT (A–L). SHG intensity values from z-stack images in intima (M) and in adventitia (N). Coherency analysis from z-stack in intima (O) and in adventitia (P). Data on graphs show mean ± SD. Data analysed by Dunnett’s multiple comparisons test (native as control group). ** p < 0.01, * p < 0.05.

