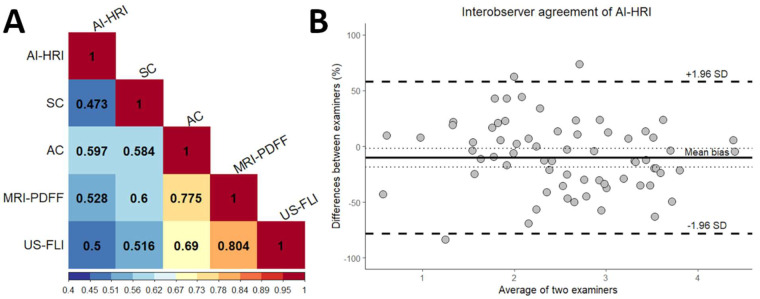
Figure 5.
(A) The correlation matrix between imaging methods is displayed on a colored heat map. The amount of steatosis was determined with quantitative ultrasound (QUS) metrics, including artificial intelligence-calculated hepatorenal index (AI-HRI) and ultrasound attenuation coefficient (AC), ultrasound backscatter-distribution coefficient (SC), and semi-quantitative ultrasonographic fatty liver indicator (US-FLI); while magnetic resonance imaging fat fraction (MRI-PDFF) was the reference method. The Spearman’s rank correlation coefficients were calculated from pairwise comparisons. (B) The Bland–Altman plot shows interobserver agreement between AI-HRI measured by two examiners. The mean of the bias is labeled with a solid, and the upper and lower limits of agreement are with dashed lines.

