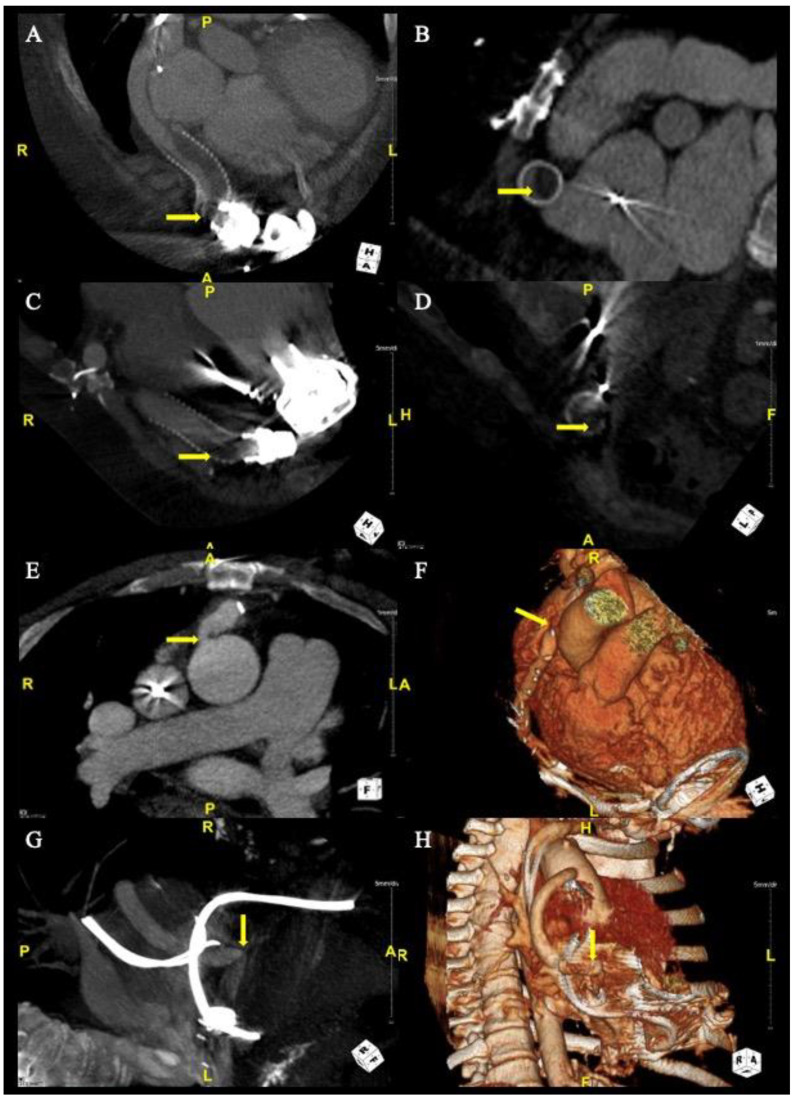
Figure 1.
Computed Tomography Angiography of Obstructions. For case 1, CTA (Panel A) demonstrates stenosis with bend relief disconnect and CTA (Panel B) demonstrates a partially occlusive thrombus. For case 5, CTAs (Panel C,D) demonstrate partially occlusive thrombus. For case 8, CTAs (Panel E,F) demonstrate ascending aorta anastomotic stenosis. For case 11, CTAs (Panel G,H) demonstrate outflow cannula kink.

