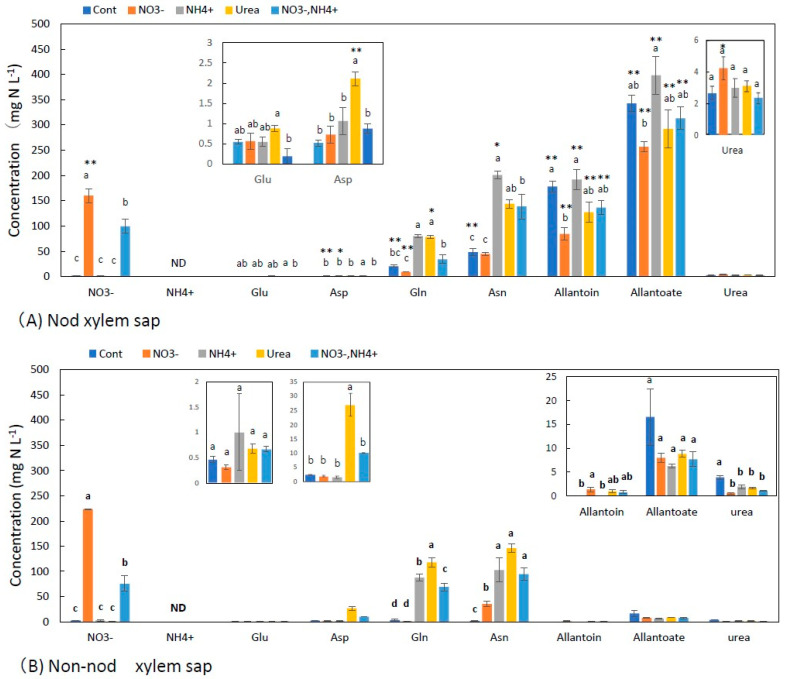
Figure 2.
Concentrations of the principal N metabolites in the xylem sap of nodulated (A) and non-nodulated (B) soybean plants treated with various N compounds. Treatments: Cont, control with N-free solution; NO3−, 5 mM KNO3; NH4+, 2.5 mM (NH4)2SO4; urea, 2.5 mM urea; NO3− + NH4+, 2.5 mM KNO3 + 1.25 mM (NH4)2SO4. n = 3. Average ± standard error. The different letters on the top of the columns indicate significant differences in the N concentration among the treatments based on Tukey’s test (p < 0.05). Asterisks (*, **) designate significant changes according to Student’s t-test results for the same compound in the same treatment between nodulated and non-nodulated plants at p < 0.05 and p < 0.01, respectively. ND; not detected.

