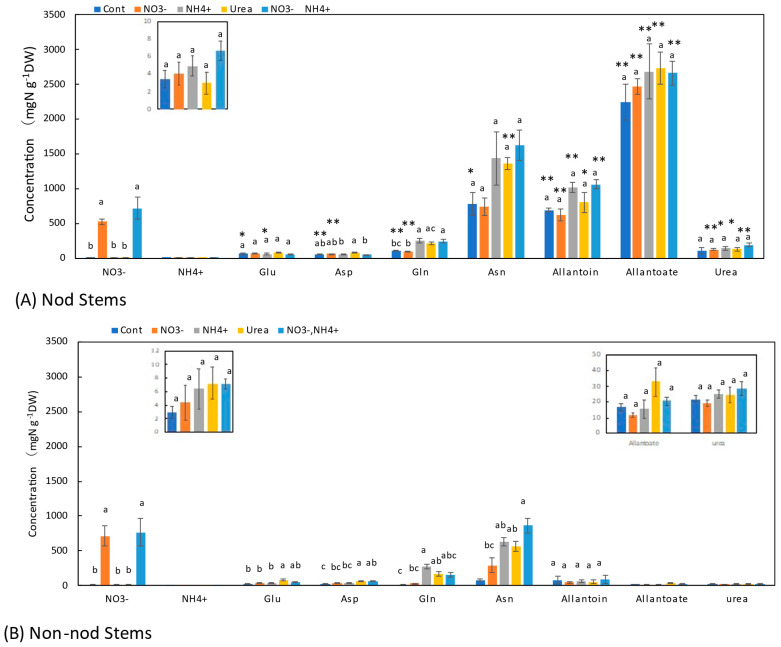
Figure 6.
Comparison of the concentrations of the principal N metabolites in the stems of the Nod and Non-nod soybean plants treated with the various N compounds. The symbols, abbreviations and the explanations of the statistics are the same as in Figure 2.

