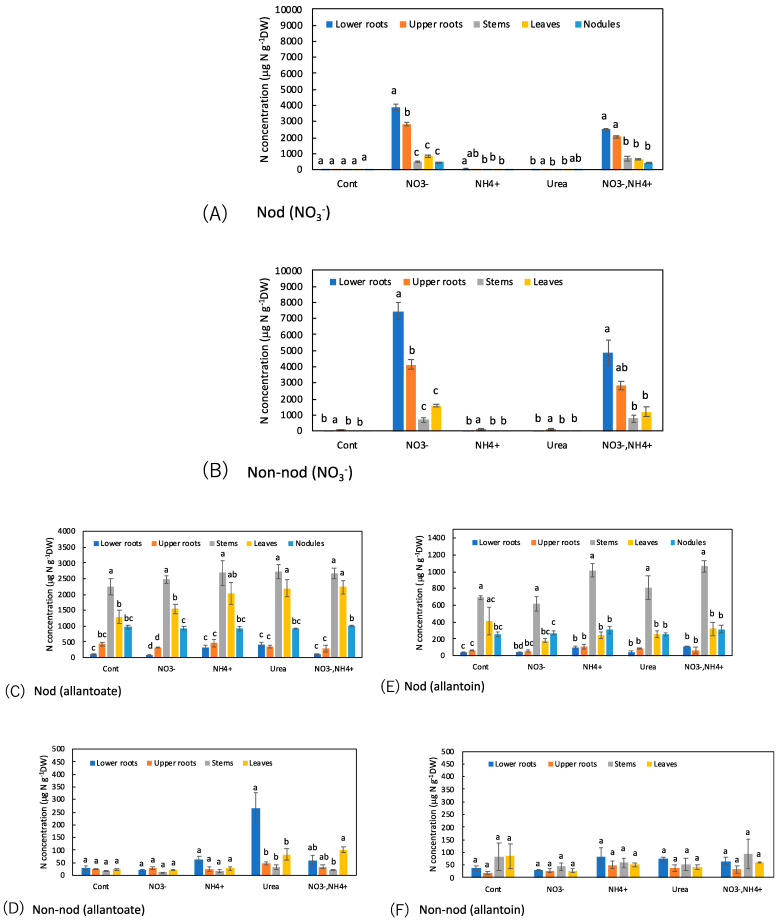
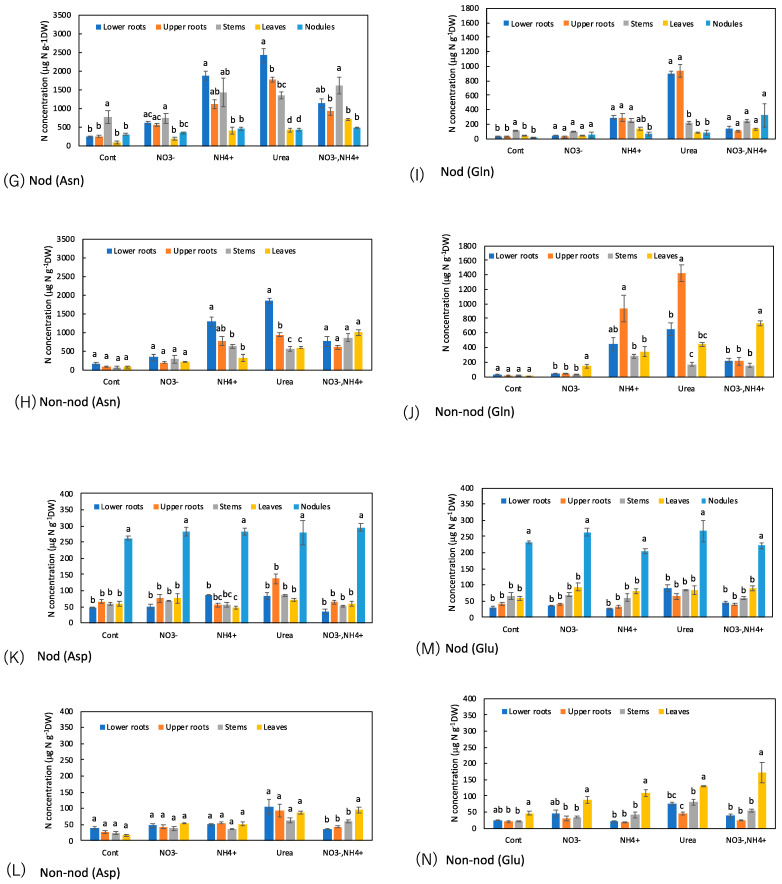
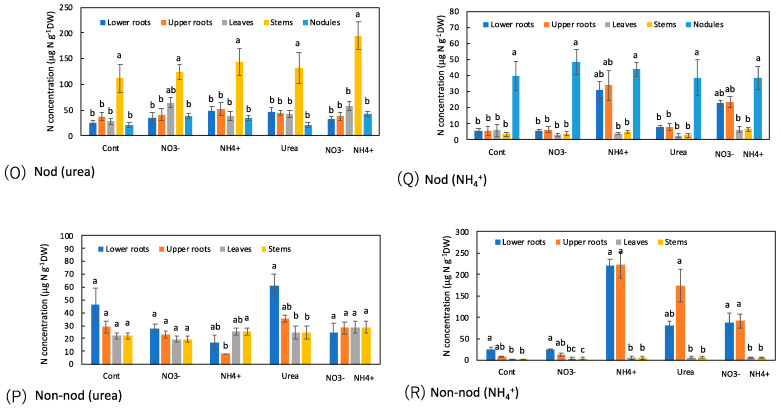
Figure 8.
Comparison of the concentrations of N metabolites among the organs of the Nod and Non-nod soybean plants treated with the various N compounds: (A,B) NO3−; (C,D) allantoate; (E,F) allantoin; (G,H) Asn; (I,J) Gln; (K,L) Asp; (M,N) Glu; (O,P) urea; (Q,R) NH4+. (A,C,E,G,I,K,M,O,Q) nodulated plants; (B,D,F,H,J,L,N,P,R) non-nodulated plants. Treatments: Cont, control with N-free solution; NO3−, 5 mM KNO3; NH4+, 2.5 mM (NH4)2SO4; urea, 2.5 mM urea; and NO3− + NH4+, 2.5 mM KNO3 + 1.25 mM (NH4)2SO4. n = 3. Average ± standard error. Different letters on the top of the columns indicate significant differences in the N concentrations among the organs based on Tukey’s test (p < 0.05).


