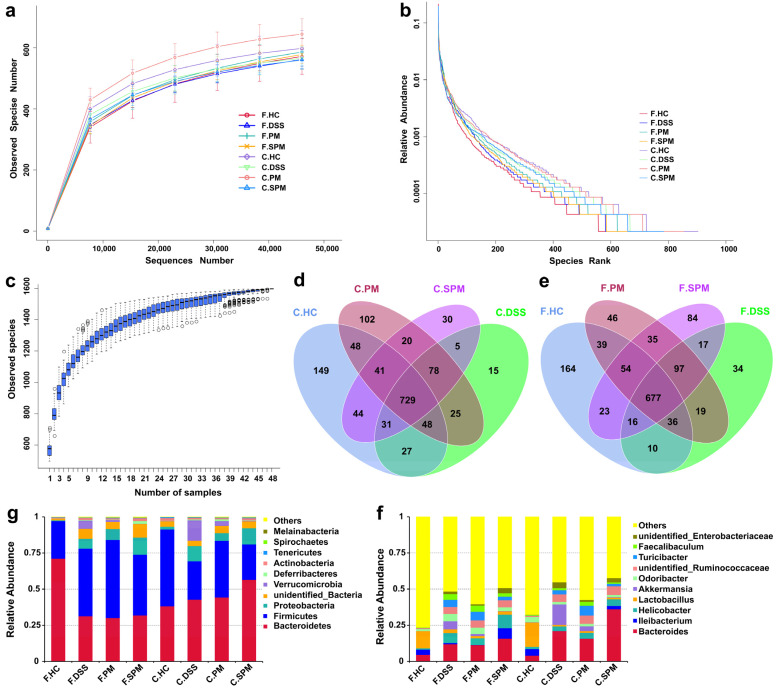
Figure 6.
Sample complexity analysis and species distribution of the gut flora in mice. (a) Rarefaction curve; (b) Rank abundance curve; (c) Species accumulation boxplot; (d) OTUs Venn diagram of cecum contents; (e) OTUs Venn diagram of feces; (g) Relative abundance of species at the phylum level; (f) Relative abundance of species at the genus level. F, Feces; C, Cecum contents.

