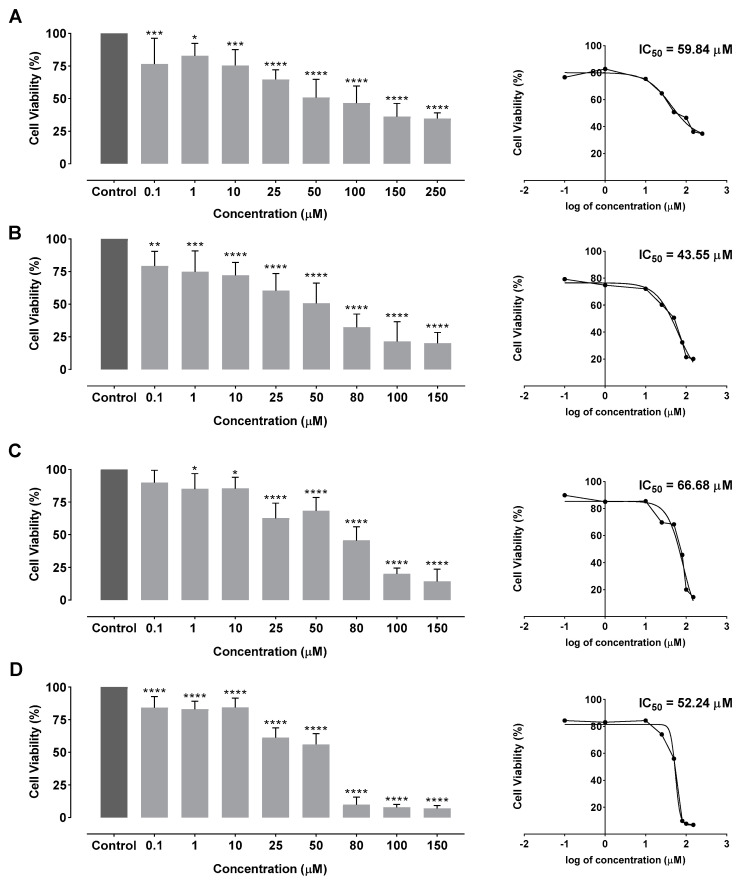
Figure 6.
Cellular viability and dose-response curves on HeLa cells after 48 h incubation by MTT assay for (A) free quercetin; (B) HMW chitosan/SBE–β–CD/quercetin delivery systems; (C) LMW chitosan/SBE–β–CD/quercetin delivery systems; and (D) 5 kDa chitosan/SBE–β–CD/quercetin delivery systems. Non-transfected cells were used as control. Free quercetin and delivery systems were tested between the concentration range of 0.1 µM and 250 µM. Data are presented as mean ± SD for three independent experiments (n = 3) with four technical replicates and analyzed by one-way ANOVA with the Bonferroni test. Significance was determined as p-values * <0.05, ** <0.01, *** <0.001, **** <0.0001.

