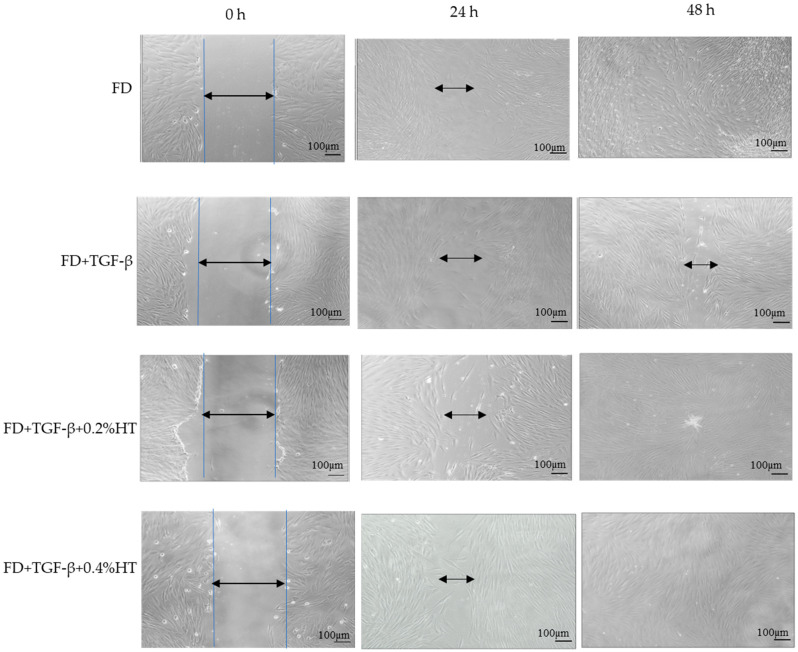
Figure 3.
Representative pictures show the migration of HDF cells at magnification ×10 after induction of a scratch. Pictures illustrate that cells treated with HT show a higher migration rate compared to the TGF-β group. All the pictures were taken immediately after the scratch was induced (0 h), and after 24 h and 48 h. Scale bar = 100 µm.

