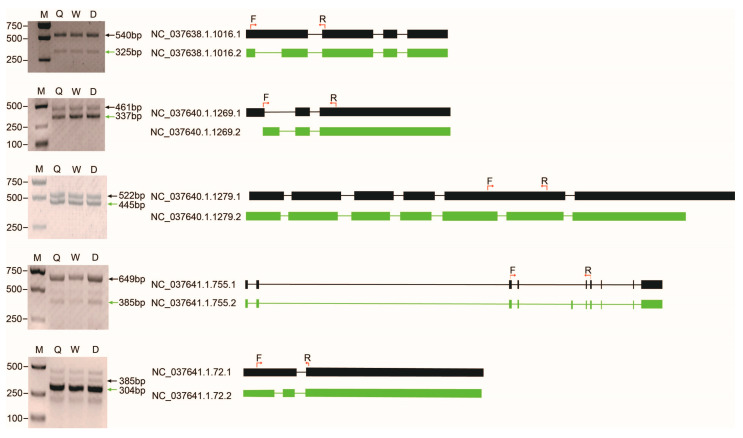
Figure 4.
Verification of the alternative splicing events in five genes by RT-PCR and Sanger sequencing. The exon/intron structure of each isoform of each gene is shown in the right panel. The filled boxes represent exons and the lines represent introns. Different isoforms of each gene are displayed in green or black. The locations of the PCR primers are shown with red arrows on the first isoform of each gene. M: marker, Q: queen, W: worker, D: drone.

