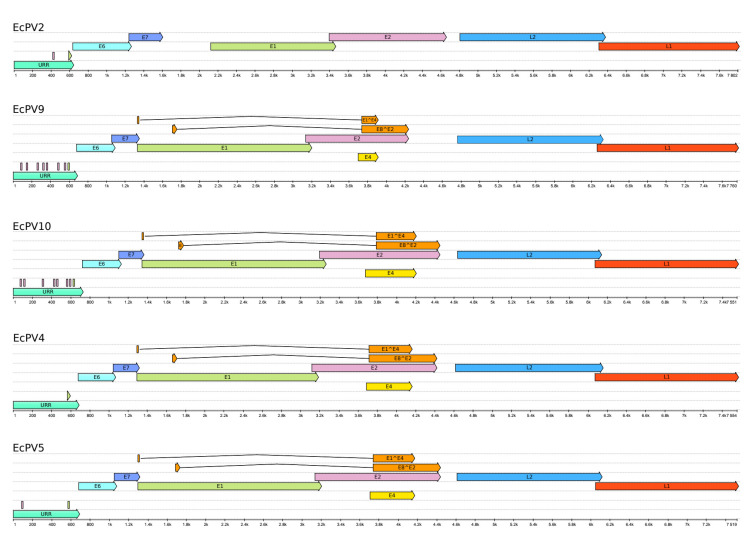
Figure 3.
Schematic representation of the closest genomes related to EcPV10. Genomes were annotated with PuMA [29], and each ORFs or regulatory region is indicated with different colors. The picture was obtained with UGENE v36.0 www.ugene.net (accessed on 2 January 2023) and edited with Inkscape v0.92 (www.inkscape.org, accessed on 2 January 2023).

