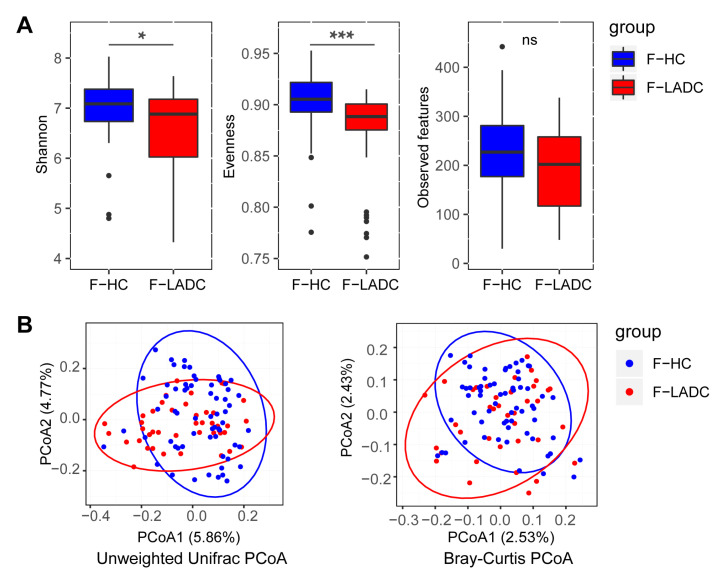
Figure 1.
Gut microbiota dysbiosis in patients with LADC. (A) Differences in α-diversity between gut samples in LADC group (F-LADC) and healthy control group (F-HC) based on Shannon indexes, Evenness indexes, and Observed features. ***, p < 0.001; *, p < 0.05; ns, not significant. (B) β-Diversity differences between the LADC (red dots) and HC (blue dots) groups were estimated by principal coordinates analysis (PCoA). Left, unweighted UniFrac PCoA; right, Bray–Curtis PCoA. The percentage of variance explained by the first two principal coordinates is indicated in parentheses. Significant differences were observed between patients with LADC and healthy controls with an ANOSIM test (unweighted UniFrac, R = 0.1152, p = 0.001; Bray–Curtis, R = 0.1104, p = 0.002).

