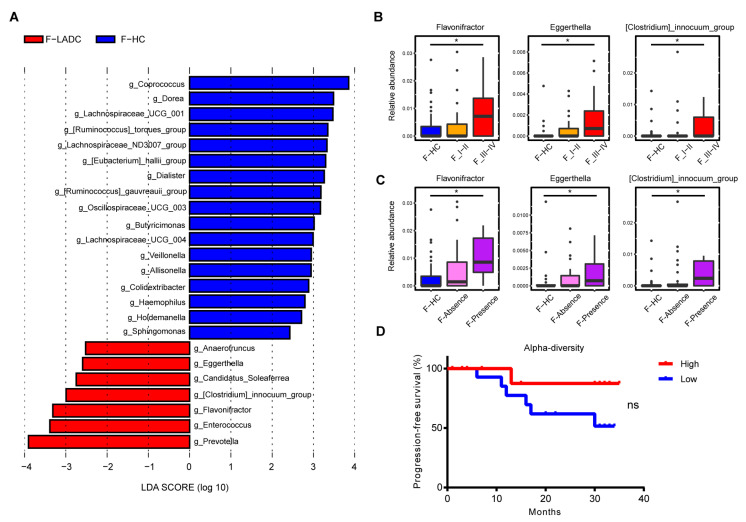
Figure 2.
Differences in abundance of gut microbiota in patients with LADC and healthy controls. (A) Histogram of the LDA scores, where the LDA score indicates the effective size and ranking of taxa at the genus level (LDA > 2). Red and blue represent the patients with LADC (n = 43) and healthy controls (n = 64), respectively. Three genera were further analyzed in the disease stage (B) and distant metastasis (C). F-HC, healthy control group (n = 64); F_I-II, early-stage LADC group (n = 23); F_III-IV, advanced-stage LADC group (n = 20); F-Absence, non-metastatic LADC group (n = 33); F-Presence, metastatic LADC group (n = 10); p-values were calculated using the two-tailed Wilcoxon rank-sum test: *, p < 0.05. (D) Survival curves of progression-free survival by evenness index. High (red) vs. low (blue) diversity; log-rank (Mantel–Cox) analysis: ns, not significant.

