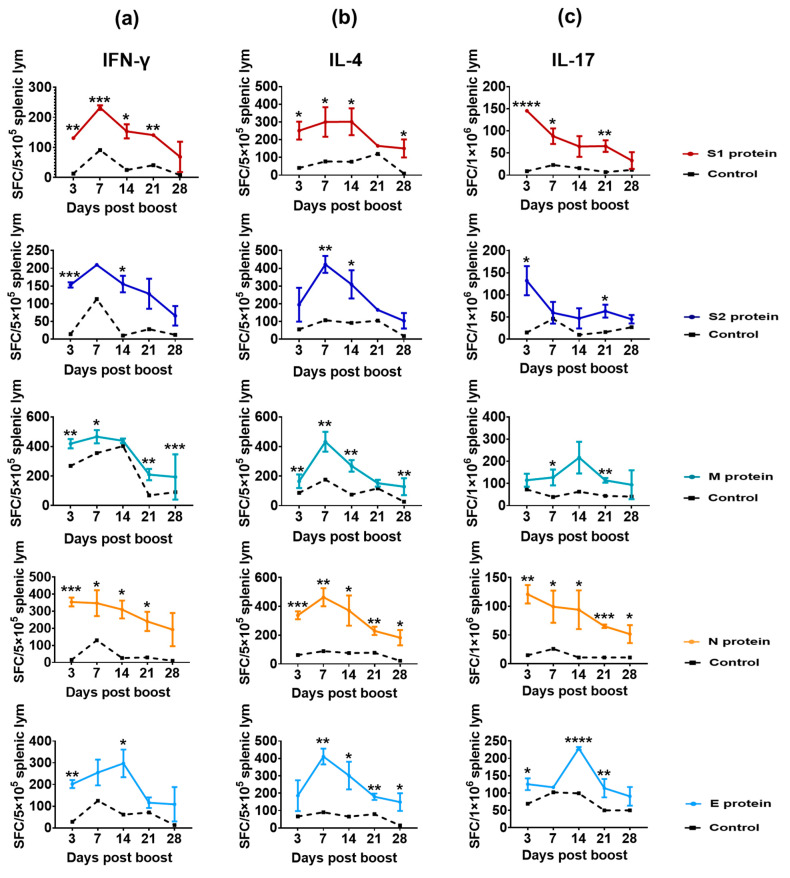
Figure 3.
Specific T-cell responses in mice immunized with inactivated SARS-CoV-2 vaccine (n = 15), analyzed by ELISpot assay. (a–c) The ELISpot responses show IFN-γ-, IL-4- and IL-17-secreting T cells among splenic lymphocytes after stimulation with the antigenic proteins S1, S2, M, N and E. The black dotted line represents the control group. Scheirer–Ray–Hare test was conducted. Bars represent the mean ± SD. * p < 0.05, ** p < 0.01, *** p < 0.001, **** p < 0.0001 vs. control.

