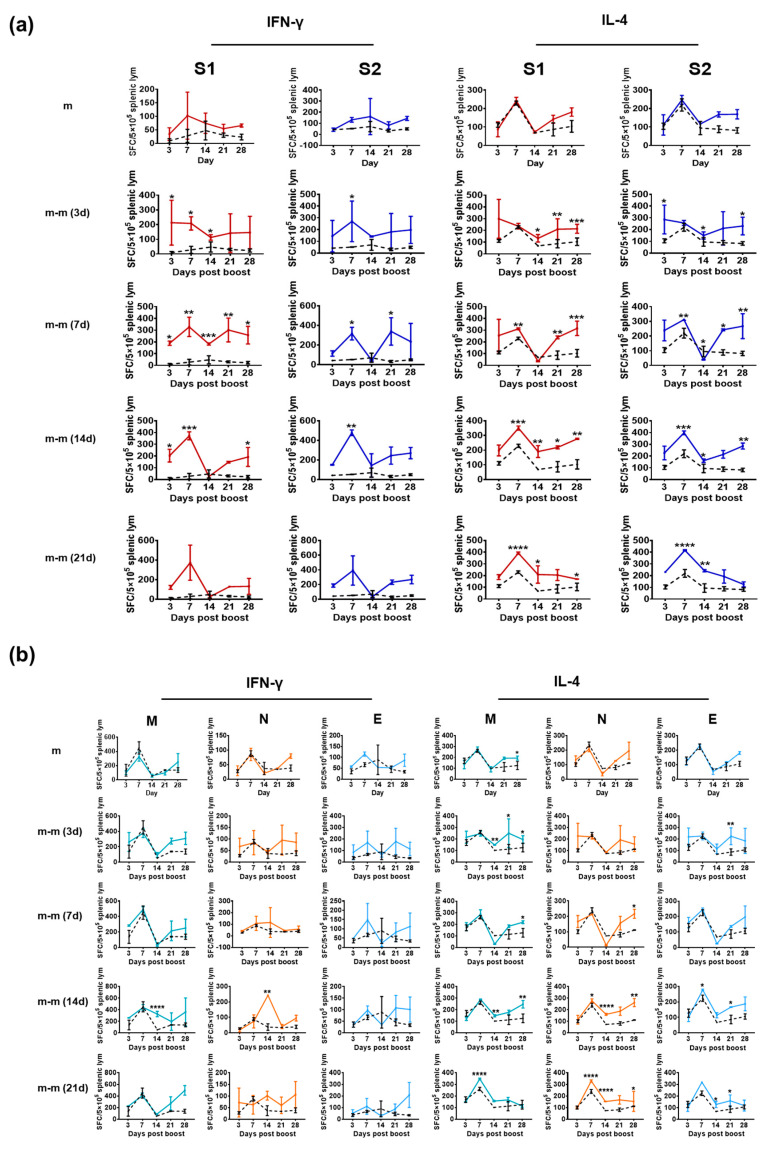
Figure 4.
Specific T-cell responses in mice immunized with SARS-CoV-2 mRNA vaccine analyzed by ELISpot assay. Groups m-m (3 d), m-m (7 d), m-m (14 d) and m-m (21 d) (n = 10 per group) received booster immunization on days 3, 7, 14 and 21 after the first mRNA vaccine dose, respectively. The black dotted line represents the control group. (a) The results of the ELISpot assay specific for IFN-γ and IL-4 suggested specific T-cell responses against S1 and S2. (b) The results of the ELISpot assay specific for IFN-γ and IL-4 suggested specific T-cell responses against M, N and E. Scheirer–Ray–Hare test was conducted. Bars represent the mean ± SD. * p < 0.05, ** p < 0.01, *** p < 0.001, **** p < 0.0001 vs. control.

