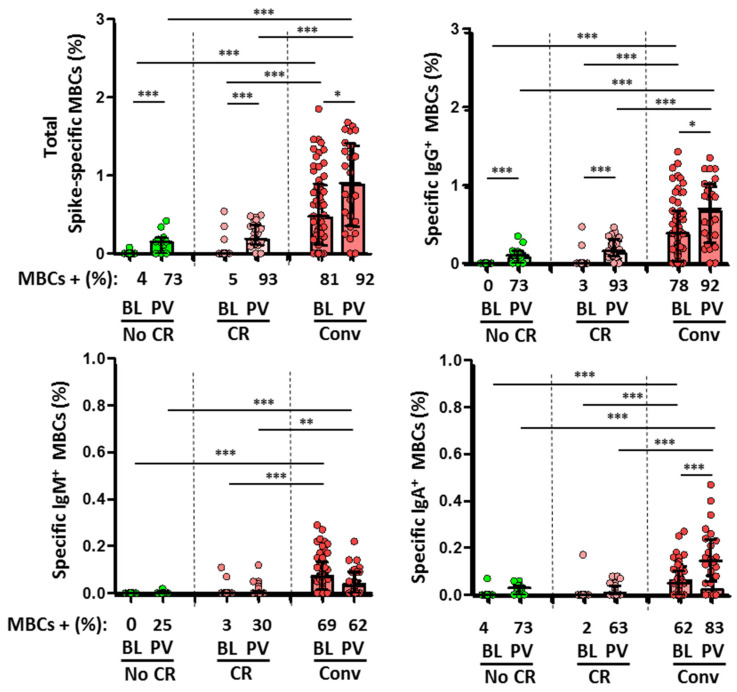
Figure 3.
Comparison of specific memory B-cells (MBCs, top left) and IgG+ MBC (top right), IgM+ MBCs (bottom left), and IgA+ MBCs (bottom right) isotypes between the different subgroups at baseline (BL) and after two doses of vaccine (PV, post-vaccination). No CR (unexposed without cross-reactivity, green dots and bars), CR (unexposed with cross-reactivity, rose dots and bars), and Conv (convalescent, red dots and bars). Frequencies are indicated at the X axis. Statistically significant when p < 0.05. * = p < 0.05, ** = p < 0.01, and *** = p < 0.001.

