Figure 2.
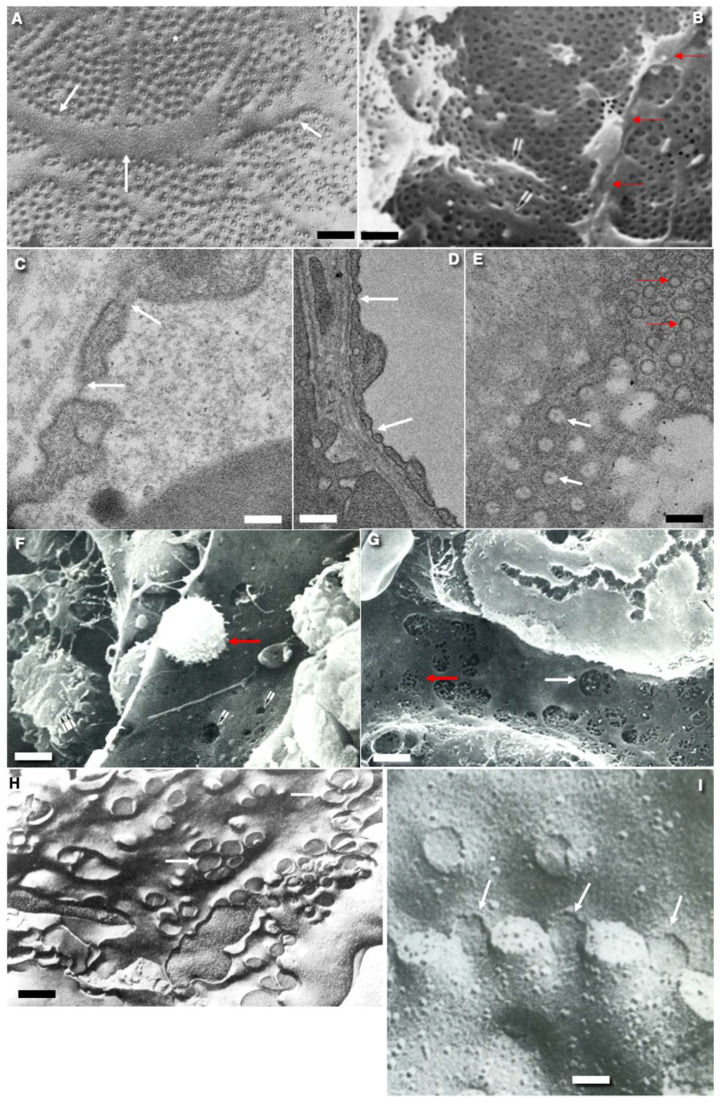
Structure of transcytosis compartments of rat endothelial cells. (A) Tangential freeze-fracture of the endothelium of blood capillary in frozen intestinal villus. White asterisks indicate the fields of fenestrae. White arrows demonstrate the thick zone of endothelial cytoplasm between the fields of fenestrae. (B) Scanning electron microscopy (SEM) of the surface of the thin endothelium with small pores in the glomerular blood capillary. Red arrows indicate the intercellular contact. (C,D) Thin fenestrated endothelium. Transmission electron microscopic (TEM) sections across the blood capillary of intestinal villus. White arrows demonstrate fenestrae. Red arrows show cross section of caveolae. (E) The tangential TEM section of the thin fenestrated EC. White arrows indicate fenestrae. Red arrows show cross sections of caveolae. (F) Scanning electron microscopic image of the lumina surface of the sinusoid in rat red bone marrow. White arrows indicate large pores. Red arrow shows lymphocyte. (G) SEM of the luminal surface of blood sinusoid in liver. White arrow shows large pore. Red arrow demonstrates the field of small pores. (H) Tangential fracture of frozen liver blood sinusoid. White arrows shows large pores. (I) Tangential cross-fracture (after quick freezing) of the fenestrated ECs. White arrows show localization of fenestrae. Images (A,H,I) are taken from Figures 22c/в), 21e/д), and 23b (correspondingly) presented by Komissarchik and Mironov [19]. Images (B,F,G) are taken from Figures 125, 152 and 126 (correspondingly) presented by Volkova et al. [10]. The images (C–E) are taken from Figure 6D and Supplementary images presented by Sesorova et al. [18] in agreement with the CC By license. Scale bars: 1.7 µm (A,B); 100 nm (C); 170 nm (D); 130 nm (E); 5 µm (F); 7 µm (G); 1.7 m (H); 80 nm (I).

