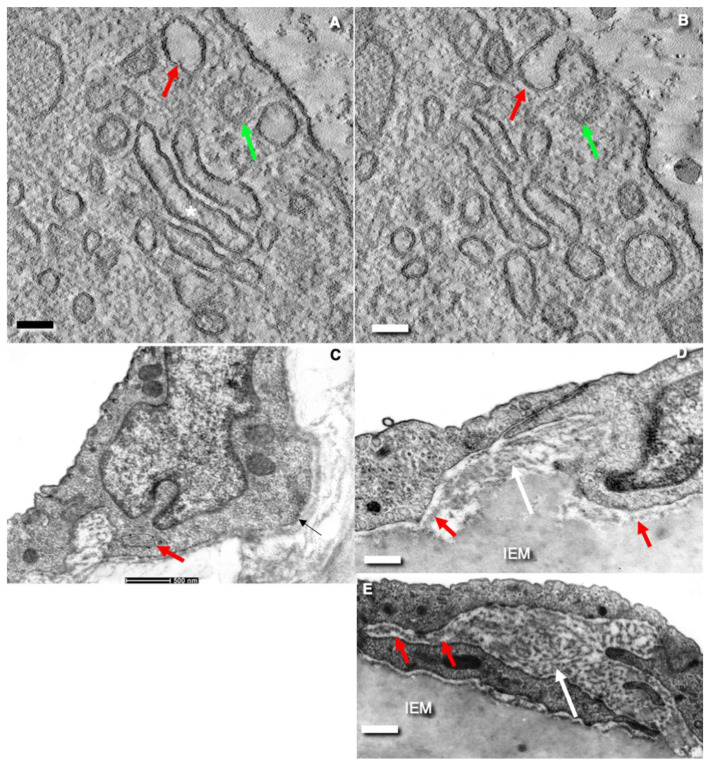
Figure 4.
Structure of rat endothelial cells. (A–D) Serial virtual tomography slices show clathrin-independent invaginations (red arrow in (A)) and clathrin-dependent invaginations (green arrows in B) of the EC APM. In (B) these seemingly isolated vacuoles are connected with the plasma membrane. The Golgi complex (asterisk in (A)) is composed of short cisternae. (C) EC from rat aorta from the zone of regenerating endothelium. EC is in the G2 phase. Red arrow shows the post-Golgi carrier filled with collagen. (D,E) ECs of aorta. Red arrows show mesh-like BM. White arrow indicates accumulation of the BM material which is more evident in the ECs from the zone of turbulent flow. Images (A,B) are taken from Supplementary Figures presented by Sesorova et al. [18]. Images (C,D) are taken from Figure 5 presented by Sesorova et al. [16]. The image (E) is taken from Figure 3C presented by Mironov et al. [6] in agreement with the CC By license. Scale bars: 85 nm (A,B); 200 nm (C); 500 nm (C); 305 nm (D,E).

