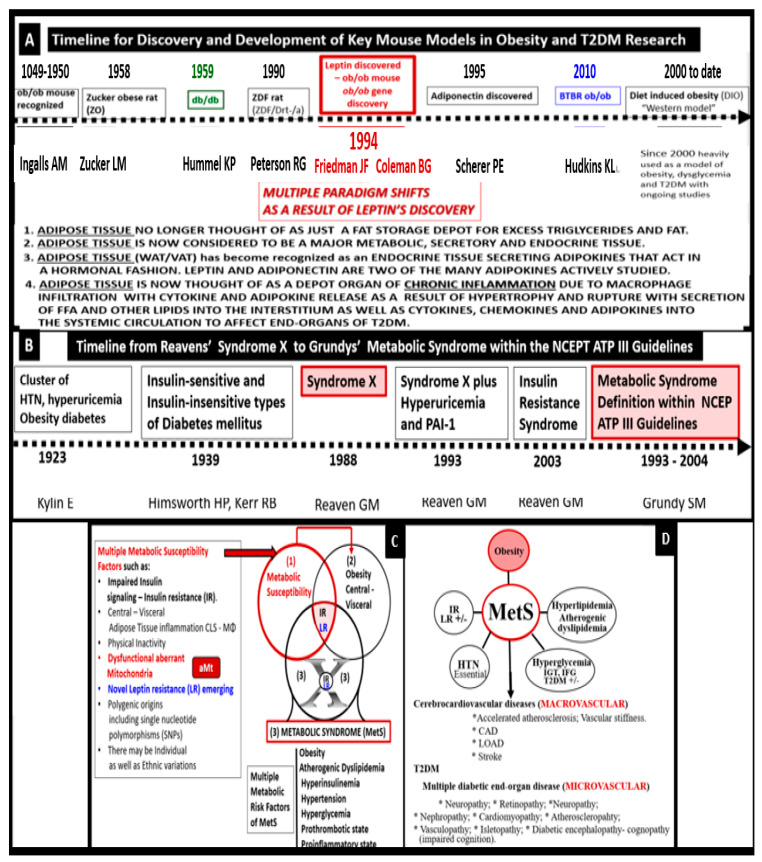
Figure 3.
Panel A demonstrates the timeline for the development of key obesity and T2DM models from 1948 to date that have resulted in multiple paradigm shifts in regard to the metabolic syndrome (MetS). Panel B demonstrates the timeline of Reaven’s syndrome X to the NCEP ATP III guidelines for the MetS and Grundy’s emphasis on the Met S. These two combined timelines allow one to compare the importance of obesity, insulin and leptin resistance to the timeline for the development of the MetS. Panel C illustrates that the MetS is associated with multiple variables and the importance of an individual’s metabolic susceptibility factors (boxed-in factors) to better understand why only some obese individuals develop MetS. Panel D depicts that the MetS is associated with multiple variables and an increased risk for cerebrocardiovascular disease (CCVD) via macrovascular disease, while diabetic end-organ disease is associated with type 2 diabetes mellitus (T2DM) and microvascular disease. Panel A is adapted and modified with permission by CC 4.0 [30]. FFA = free fatty acids; VAT = visceral adipose tissue; WAT = white adipose tissue.

